1 项目概述
| 项目编号 | GHR180993_sstd_42 |
| 项目内容 | Mus_musculus --- 2 scRNA-seq |
| 参考基因组 | mm10 |
| 样品信息 | Control¦DDC |
2 项目流程
2.1 实验流程
 |
| Fig 2-1-1 10x单细胞实验流程图 |
- 细胞质检
取少量单细胞悬液,加入等体积0.4%台盼蓝染液,用 Countess® II Automated Cell Counter 对细胞计数,将活细胞浓度调整到理想浓度(1000~2000个/μL)。 - 10X 标记 cDNA 片段
含有 barcode 信息的凝胶珠与细胞和酶的混合物结合,进入储液器中被油分隔开,形成GEMs(Gel Beads-In-Emulsions)。之后,凝胶珠溶解释放含有Barcode序列的捕获序列,逆转录 cDNA 片段,并对样本进行标记。将凝胶珠破碎并打碎油滴,以 cDNA 为模板进行 PCR 扩增。将所有GEMs的产物混合,构建标准测序文库。 - 标准测序文库建库
首先将 cDNA 酶切打断成 200~300bp 左右的片段,然后经过末端修复、加A尾、测序接头 P5 、P7和sample index等常规二代测序文库构建步骤,最后进行 PCR 扩增得到 DNA 文库。 - 文库测序
利用Illumina测序平台的PE150测序模式对建好的文库进行高通量测序。
2.2 分析流程
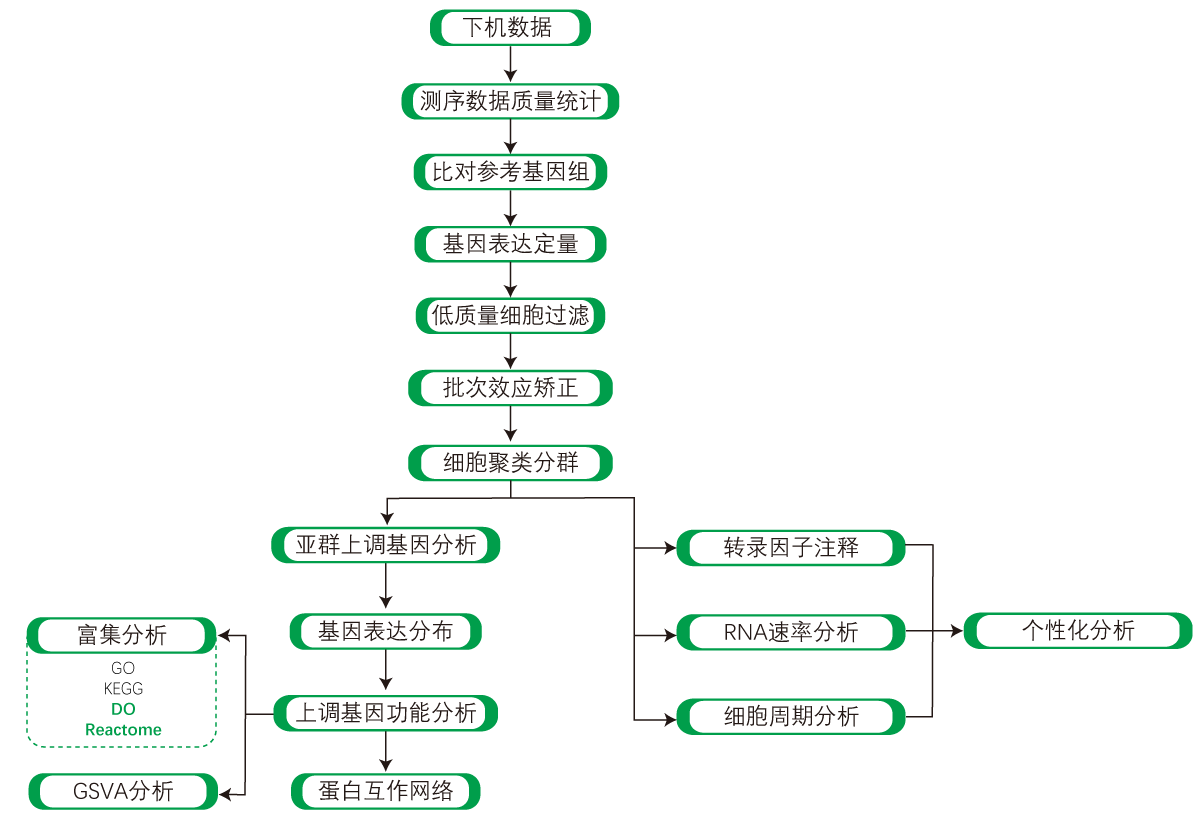 |
| Fig 2-2-1 10x单细胞分析流程图 |
3 测序数据质控和表达量定量
3.1 测序数据基本质控
使用cellranger[1],我们可以对测序质量进行质控,去除测序质量低的reads,并对每个样本测的reads数和测序质量进行初步统计。
| Sample | Number of Reads | Valid Barcodes | Sequencing Saturation | Q30 Bases in Barcode | Q30 Bases in RNA Read | Q30 Bases in UMI |
|---|---|---|---|---|---|---|
| Control | 304,237,958 | 95.3% | 42.2% | 96.7% | 92.5% | 94.7% |
| DDC | 336,368,966 | 96.1% | 41.9% | 96.5% | 91.9% | 94.5% |
3.2 数据定量
使用cellranger,我们将reads与参考基因组进行比对,将reads注释为特定基因;再对UMI进行修正和统计后,获得未过滤的feature-barcode矩阵;根据未过滤的feature-barcode矩阵,cellranger对数据中的细胞和非细胞进行识别和区分,并绘制为rank-plot图,直观体现有效细胞鉴定结果。
| Sample | Estimated Number of Cells | Fraction Reads in Cells | Mean Reads per Cell | Median Genes per Cell | Total Genes Detected | Median UMI Counts per Cell | Reads Mapped Confidently to Genome | Reads Mapped Confidently to Intergenic Regions | Reads Mapped Confidently to Intronic Regions | Reads Mapped Confidently to Exonic Regions | Reads Mapped Confidently to Transcriptome |
|---|---|---|---|---|---|---|---|---|---|---|---|
| Control | 16,755 | 70.0% | 18,158 | 1,797 | 24,280 | 3,218 | 81.6% | 8.4% | 0.0% | 73.3% | 58.9% |
| DDC | 13,755 | 71.1% | 24,454 | 2,386 | 24,656 | 4,461 | 80.7% | 7.0% | 0.0% | 73.7% | 61.1% |
- Control有效细胞
- DDC有效细胞
Fig 3-2-1 有效细胞鉴定图
各样本质控、定量结果报告:
- Control : 1.Expression/CellRanger_Report/CellRanger.Control.result.html
- DDC : 1.Expression/CellRanger_Report/CellRanger.DDC.result.html
3.3 最终鉴定细胞表达量矩阵
基于UMI修正和有效细胞鉴定后的结果,我们可以使用UMI条数对基因进行定量,获得如下的细胞-基因表达量定量结果。
| GeneID | Name | AAACCCAAGAAACTCA-1 | AAACCCAAGAAGTATC-1 | AAACCCAAGAGGGCGA-1 | AAACCCAAGCCATTGT-1 | AAACCCAAGGGCTAAC-1 | AAACCCAAGTGCTCAT-1 | AAACCCACACATTACG-1 | AAACCCACACTCACTC-1 | AAACCCAGTATAGCTC-1 |
|---|---|---|---|---|---|---|---|---|---|---|
| ENSMUSG00000051951 | Xkr4 | 0 | 0 | 0 | 0 | 0 | 0 | 0 | 0 | 0 |
| ENSMUSG00000089699 | Gm1992 | 0 | 0 | 0 | 0 | 0 | 0 | 0 | 0 | 0 |
| ENSMUSG00000102331 | Gm19938 | 0 | 0 | 0 | 0 | 0 | 0 | 0 | 0 | 0 |
| ENSMUSG00000102343 | Gm37381 | 0 | 0 | 0 | 0 | 0 | 0 | 0 | 0 | 0 |
| ENSMUSG00000025900 | Rp1 | 0 | 0 | 0 | 0 | 0 | 0 | 0 | 0 | 0 |
| ENSMUSG00000025902 | Sox17 | 0 | 0 | 0 | 0 | 0 | 0 | 0 | 1 | 0 |
| ENSMUSG00000104238 | Gm37587 | 0 | 0 | 0 | 0 | 0 | 0 | 0 | 0 | 0 |
| ENSMUSG00000104328 | Gm37323 | 0 | 0 | 0 | 0 | 0 | 0 | 0 | 0 | 0 |
| ENSMUSG00000033845 | Mrpl15 | 1 | 0 | 0 | 0 | 0 | 0 | 0 | 0 | 0 |
| ENSMUSG00000025903 | Lypla1 | 0 | 0 | 0 | 0 | 0 | 0 | 0 | 0 | 0 |
| ENSMUSG00000104217 | Gm37988 | 0 | 0 | 0 | 0 | 1 | 0 | 1 | 0 | 0 |
| ENSMUSG00000033813 | Tcea1 | 0 | 0 | 0 | 0 | 2 | 0 | 0 | 0 | 0 |
| ENSMUSG00000002459 | Rgs20 | 0 | 0 | 0 | 0 | 0 | 0 | 0 | 0 | 0 |
| ENSMUSG00000085623 | Gm16041 | 0 | 0 | 0 | 0 | 0 | 0 | 0 | 0 | 0 |
| ENSMUSG00000033793 | Atp6v1h | 0 | 1 | 0 | 0 | 0 | 0 | 1 | 3 | 0 |
| ENSMUSG00000025905 | Oprk1 | 0 | 0 | 0 | 0 | 0 | 0 | 0 | 0 | 0 |
| ENSMUSG00000033774 | Npbwr1 | 0 | 0 | 0 | 0 | 0 | 0 | 0 | 0 | 0 |
| ENSMUSG00000025907 | Rb1cc1 | 1 | 0 | 1 | 0 | 2 | 0 | 4 | 0 | 1 |
| ENSMUSG00000090031 | 4732440D04Rik | 0 | 0 | 0 | 0 | 0 | 0 | 0 | 0 | 1 |
| ENSMUSG00000087247 | Alkal1 | 0 | 0 | 0 | 0 | 0 | 0 | 0 | 0 | 0 |
备注:由于单个细胞在某个瞬间,只有小部分基因表达,因此表中大量基因UMI丰度为0。
UMI定量总表文件:
- Control : 1.Expression/expressions/Control/expression.xls
- DDC : 1.Expression/expressions/DDC/expression.xls
4 单细胞亚群分类
在cellranger完成基因表达量鉴定后,我们将表达量矩阵转入Seurat[2]进行后续的分析。
4.1 非正常细胞的进一步过滤
cellranger的细胞过滤是根据基因表达量进行自动识别,会有部分非正常细胞残留,所以在进行亚群分类之前,我们首先使用Seurat对非正常细胞进行进一步过滤。
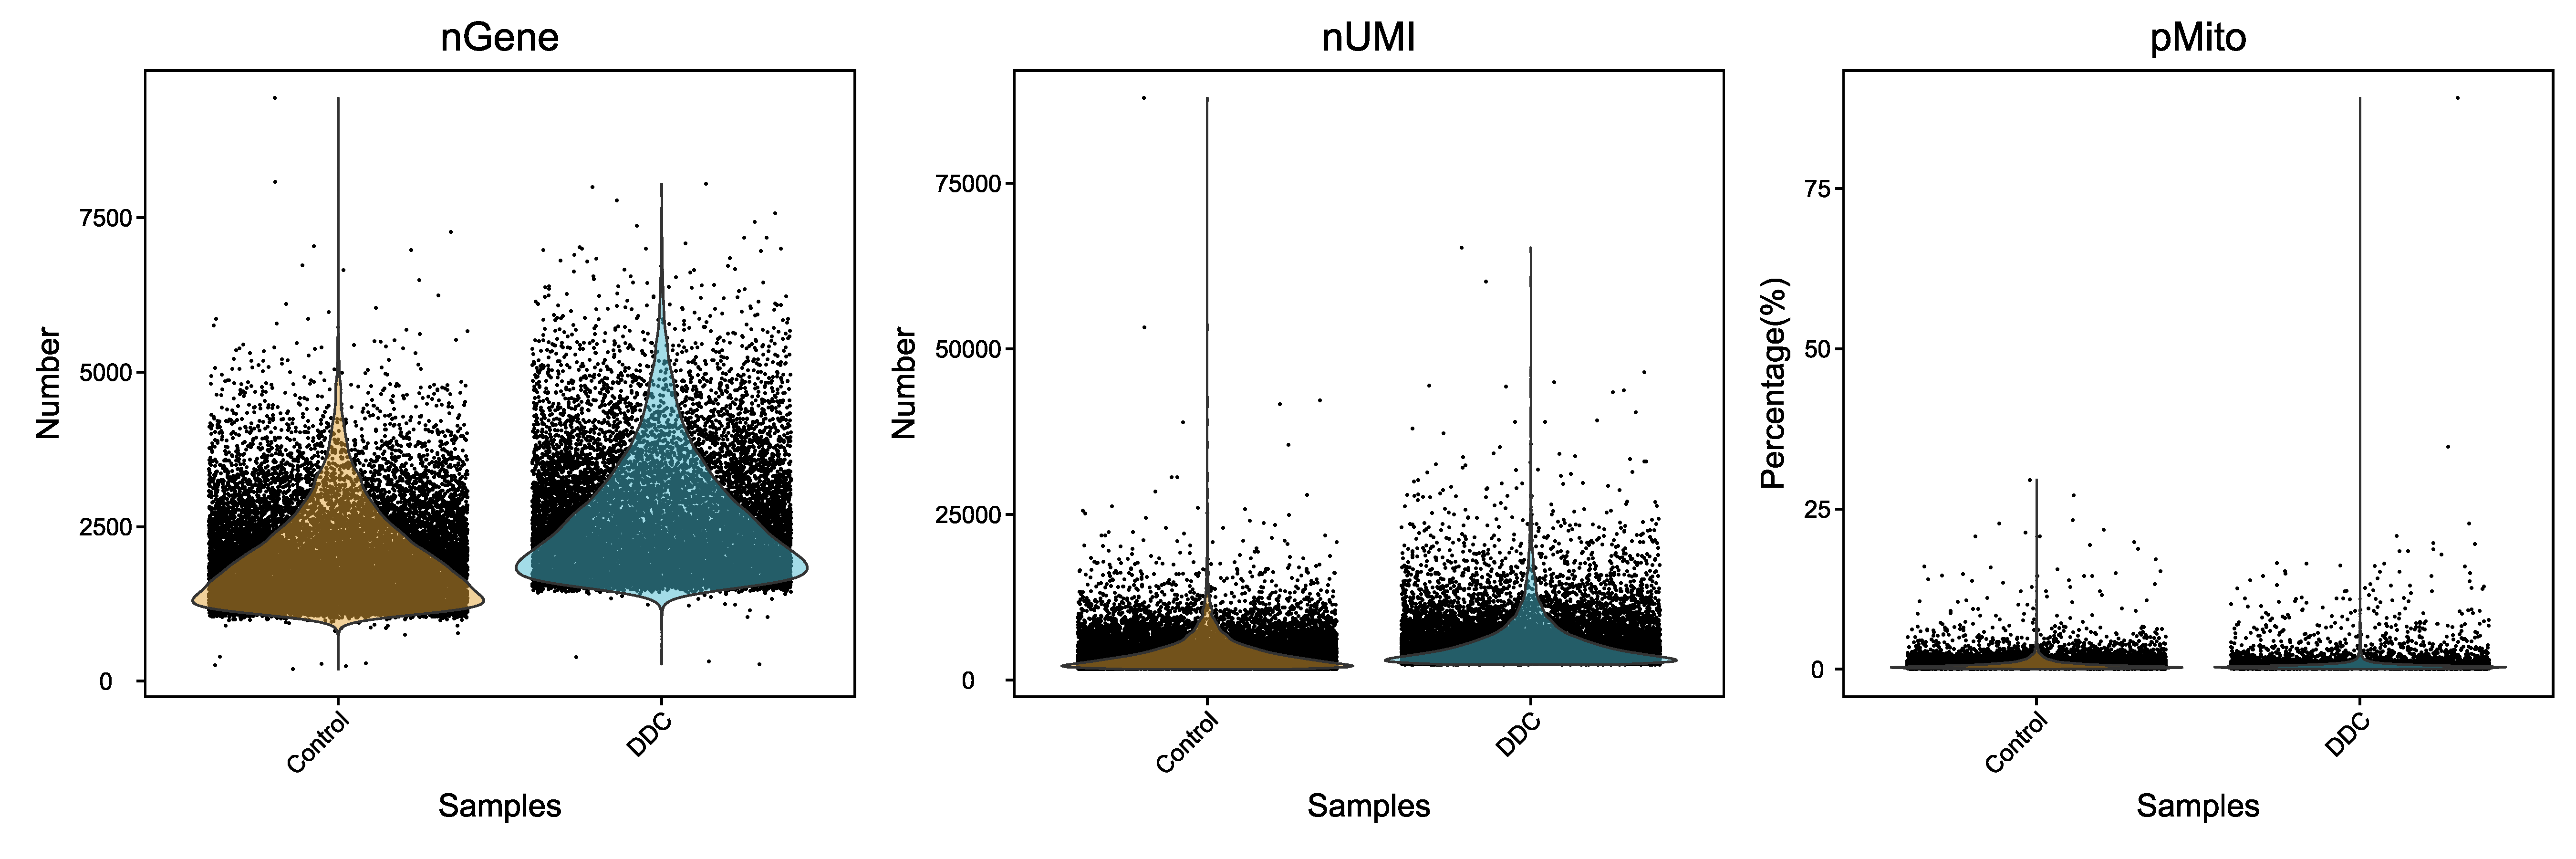
我们进行过滤的指标主要为以下三个:
- 单细胞中鉴定到的基因数量(500-3800)。对于同一种细胞来说,表达基因的数量一般维持在一定范围内,如果该值过高,可能是一个GEM中包裹了多种细胞类型,这样的barcode应该剔除
- 单细胞中UMI的总数(600-9000)。单个细胞中可以存在的mRNA总量是有限的,如果UMI总数过高,则可能是两个或两个以上的细胞进入同一个GEM中,这样的细胞应该剔除
- 单细胞中线粒体基因表达量比例(小于20%)。细胞凋亡通常伴随着线粒体基因的高表达,所以线粒体基因的高表达意味着细胞状态不佳,这些细胞在实验过程中受到了不良刺激,不利于后续分析反应真实的细胞情况,这样的细胞应该剔除
| Samples | before_filter_num | after_filter_num | pct | before_filter_median_UMI_per_cell | after_filter_median_UMI_per_cell | before_filter_median_genes_per_cell | after_filter_median_genes_per_cell | before_filter_median_MT_per_cell | after_filter_median_MT_per_cell |
|---|---|---|---|---|---|---|---|---|---|
| Control | 16755 | 15927 | 95.06% | 3218 | 3116 | 1797 | 1754 | 0.467836257309942 | 0.482758620689655 |
| DDC | 13755 | 11839 | 86.07% | 4461 | 4050 | 2386 | 2240 | 0.379266750948167 | 0.41232112539413 |
 |
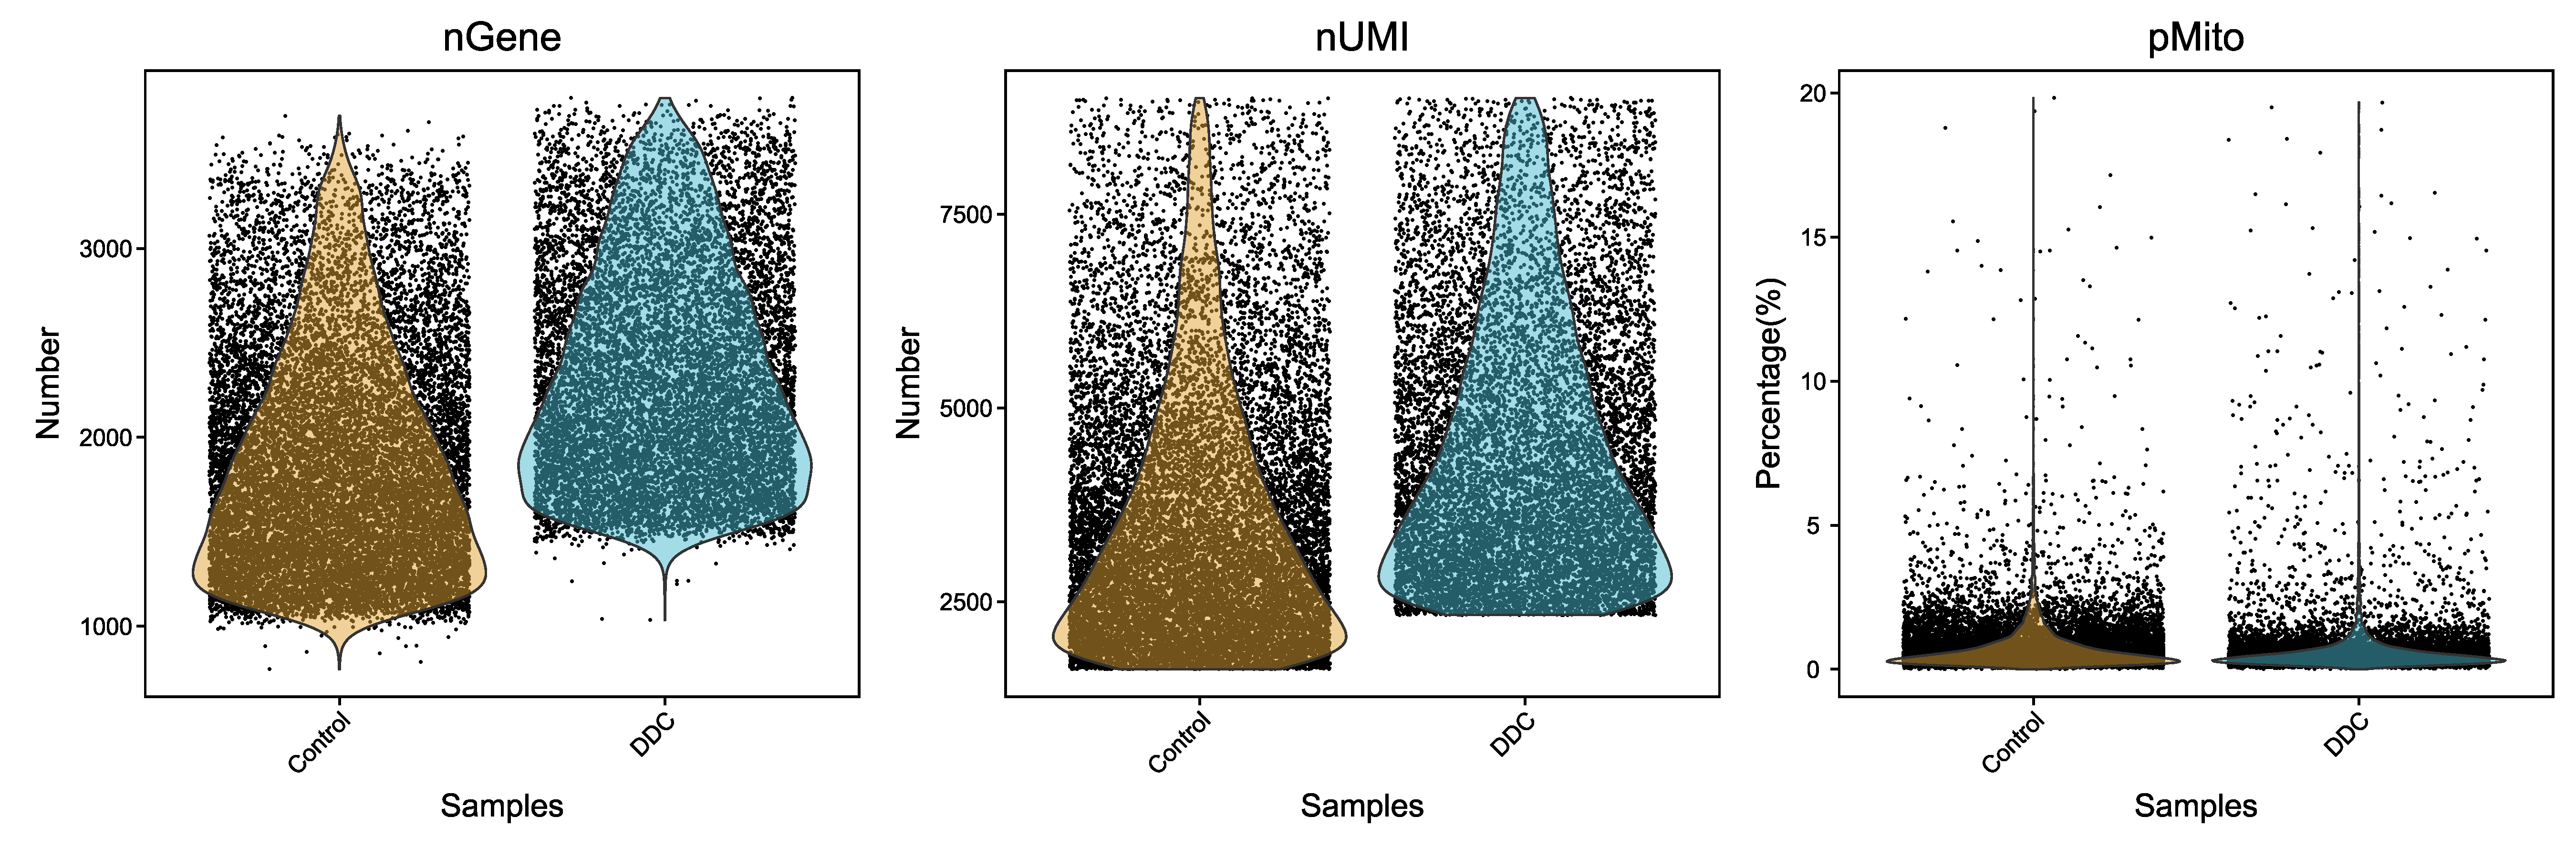 |
| Fig 4-1-1 过滤前后各个样本细胞基本信息的分布图 |
- nUMI与nGene的关系
- nUMI与pMito的关系
Fig 4-1-2 过滤前后各个样本细胞基本信息的分布散点图
 |
 |
|
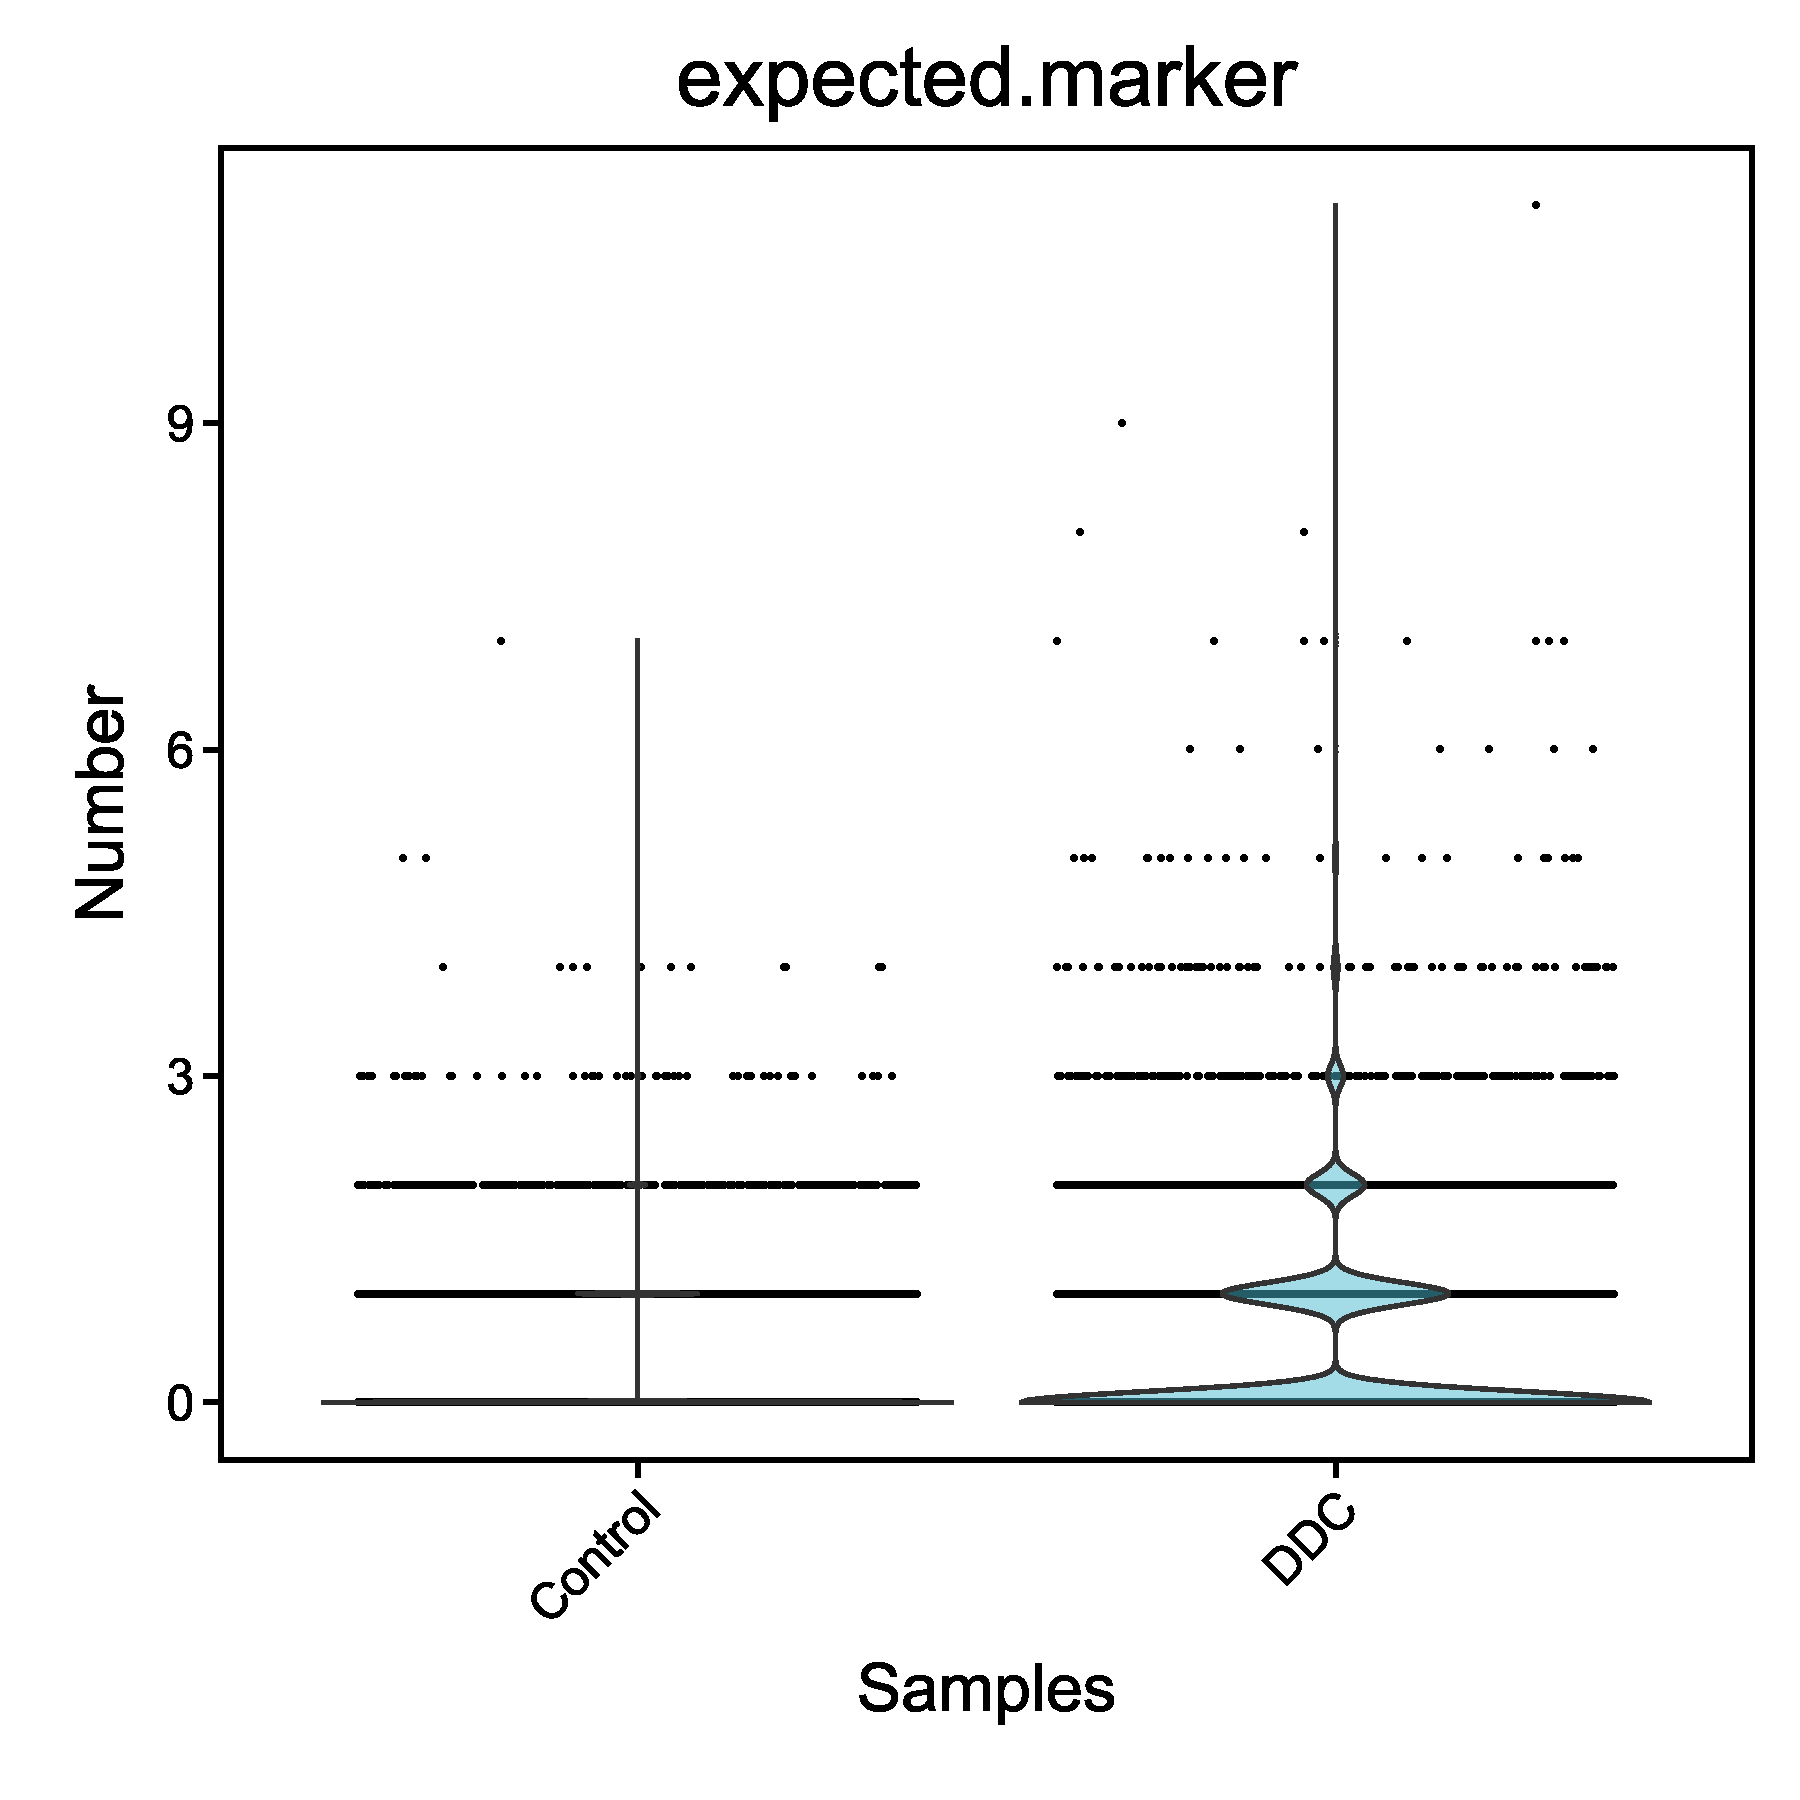
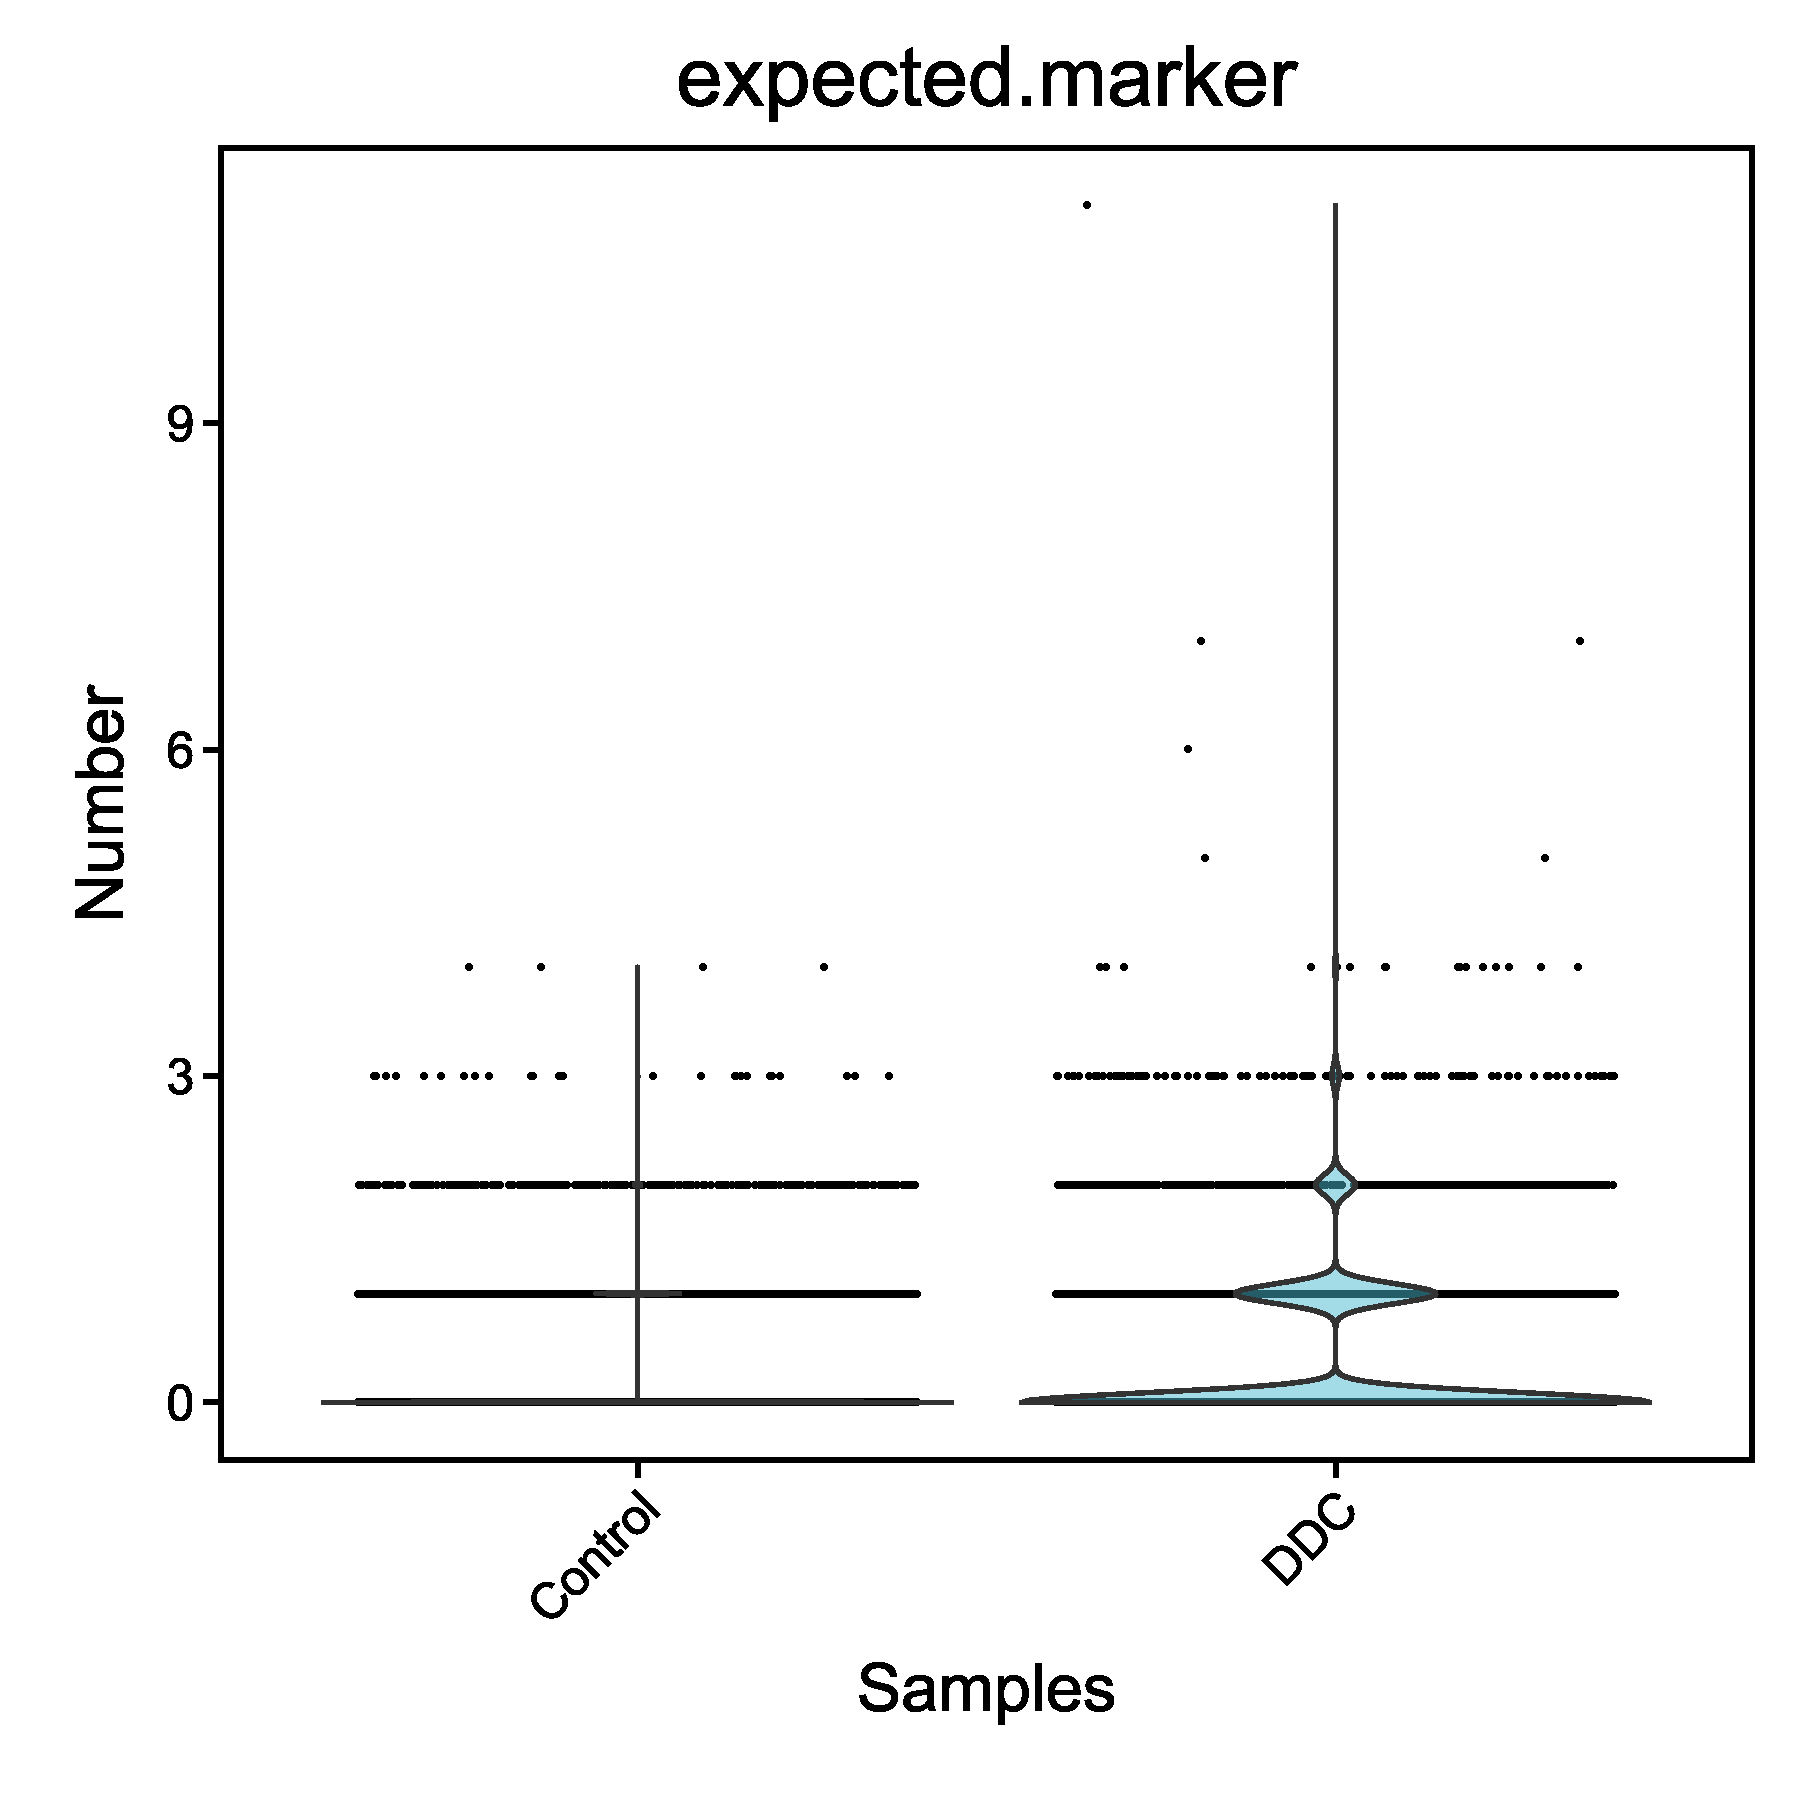
| Fig 4-1-3 过滤前各个样本细胞中预设标记基因的表达量分布 |
Fig 4-1-4 过滤后各个样本细胞中预设标记基因的表达量分布 |
|
4.2 单细胞亚群分类
在去除低质量细胞后,我们需要进行批次效应矫正。首先对所有样本进行典型相关分析(Canonical Correspondence Analysis, CCA),然后寻找细胞间的最近邻接关系(Mutual Nearest Neighbors, MNN),以此构建细胞间的对应关系,最后,多个样本以细胞间对应关系作为锚点(anchors)完成数据整合并完成批次效应矫正[3]。
| Cluster | Cells number | Median Genes per Cell | Median UMI Counts per Cell |
|---|---|---|---|
| 0 | 3904 | 1698 | 2993.5 |
| 1 | 3327 | 1860 | 3303 |
| 2 | 2919 | 2092 | 3749 |
| 3 | 2875 | 1830 | 3305 |
| 4 | 2729 | 1689 | 2903 |
| 5 | 2633 | 2213 | 4034 |
| 6 | 1918 | 1981 | 3608.5 |
| 7 | 1159 | 2362 | 4177 |
| 8 | 1033 | 1776 | 2979 |
| 9 | 965 | 1949 | 3245 |
| 10 | 719 | 1783 | 2984 |
| 11 | 698 | 1749 | 3080 |
| 12 | 419 | 1919 | 3455 |
| 13 | 217 | 2068 | 3670 |
| 14 | 113 | 2077 | 3771 |
| 15 | 68 | 2110.5 | 3572.5 |
| 16 | 41 | 2285 | 3941 |
| Cluster | Control | DDC |
|---|---|---|
| Total | 14016 (100%) | 11721 (100%) |
| 0 | 3179 (22.68%) | 725 (6.19%) |
| 1 | 2626 (18.74%) | 701 (5.98%) |
| 2 | 48 (0.34%) | 2871 (24.49%) |
| 3 | 2444 (17.44%) | 431 (3.68%) |
| 4 | 2038 (14.54%) | 691 (5.9%) |
| 5 | 15 (0.11%) | 2618 (22.34%) |
| 6 | 1128 (8.05%) | 790 (6.74%) |
| 7 | 20 (0.14%) | 1139 (9.72%) |
| 8 | 709 (5.06%) | 324 (2.76%) |
| 9 | 406 (2.9%) | 559 (4.77%) |
| 10 | 521 (3.72%) | 198 (1.69%) |
| 11 | 664 (4.74%) | 34 (0.29%) |
| 12 | 116 (0.83%) | 303 (2.59%) |
| 13 | 87 (0.62%) | 130 (1.11%) |
| 14 | 1 (0.01%) | 112 (0.96%) |
| 15 | 7 (0.05%) | 61 (0.52%) |
| 16 | 7 (0.05%) | 34 (0.29%) |
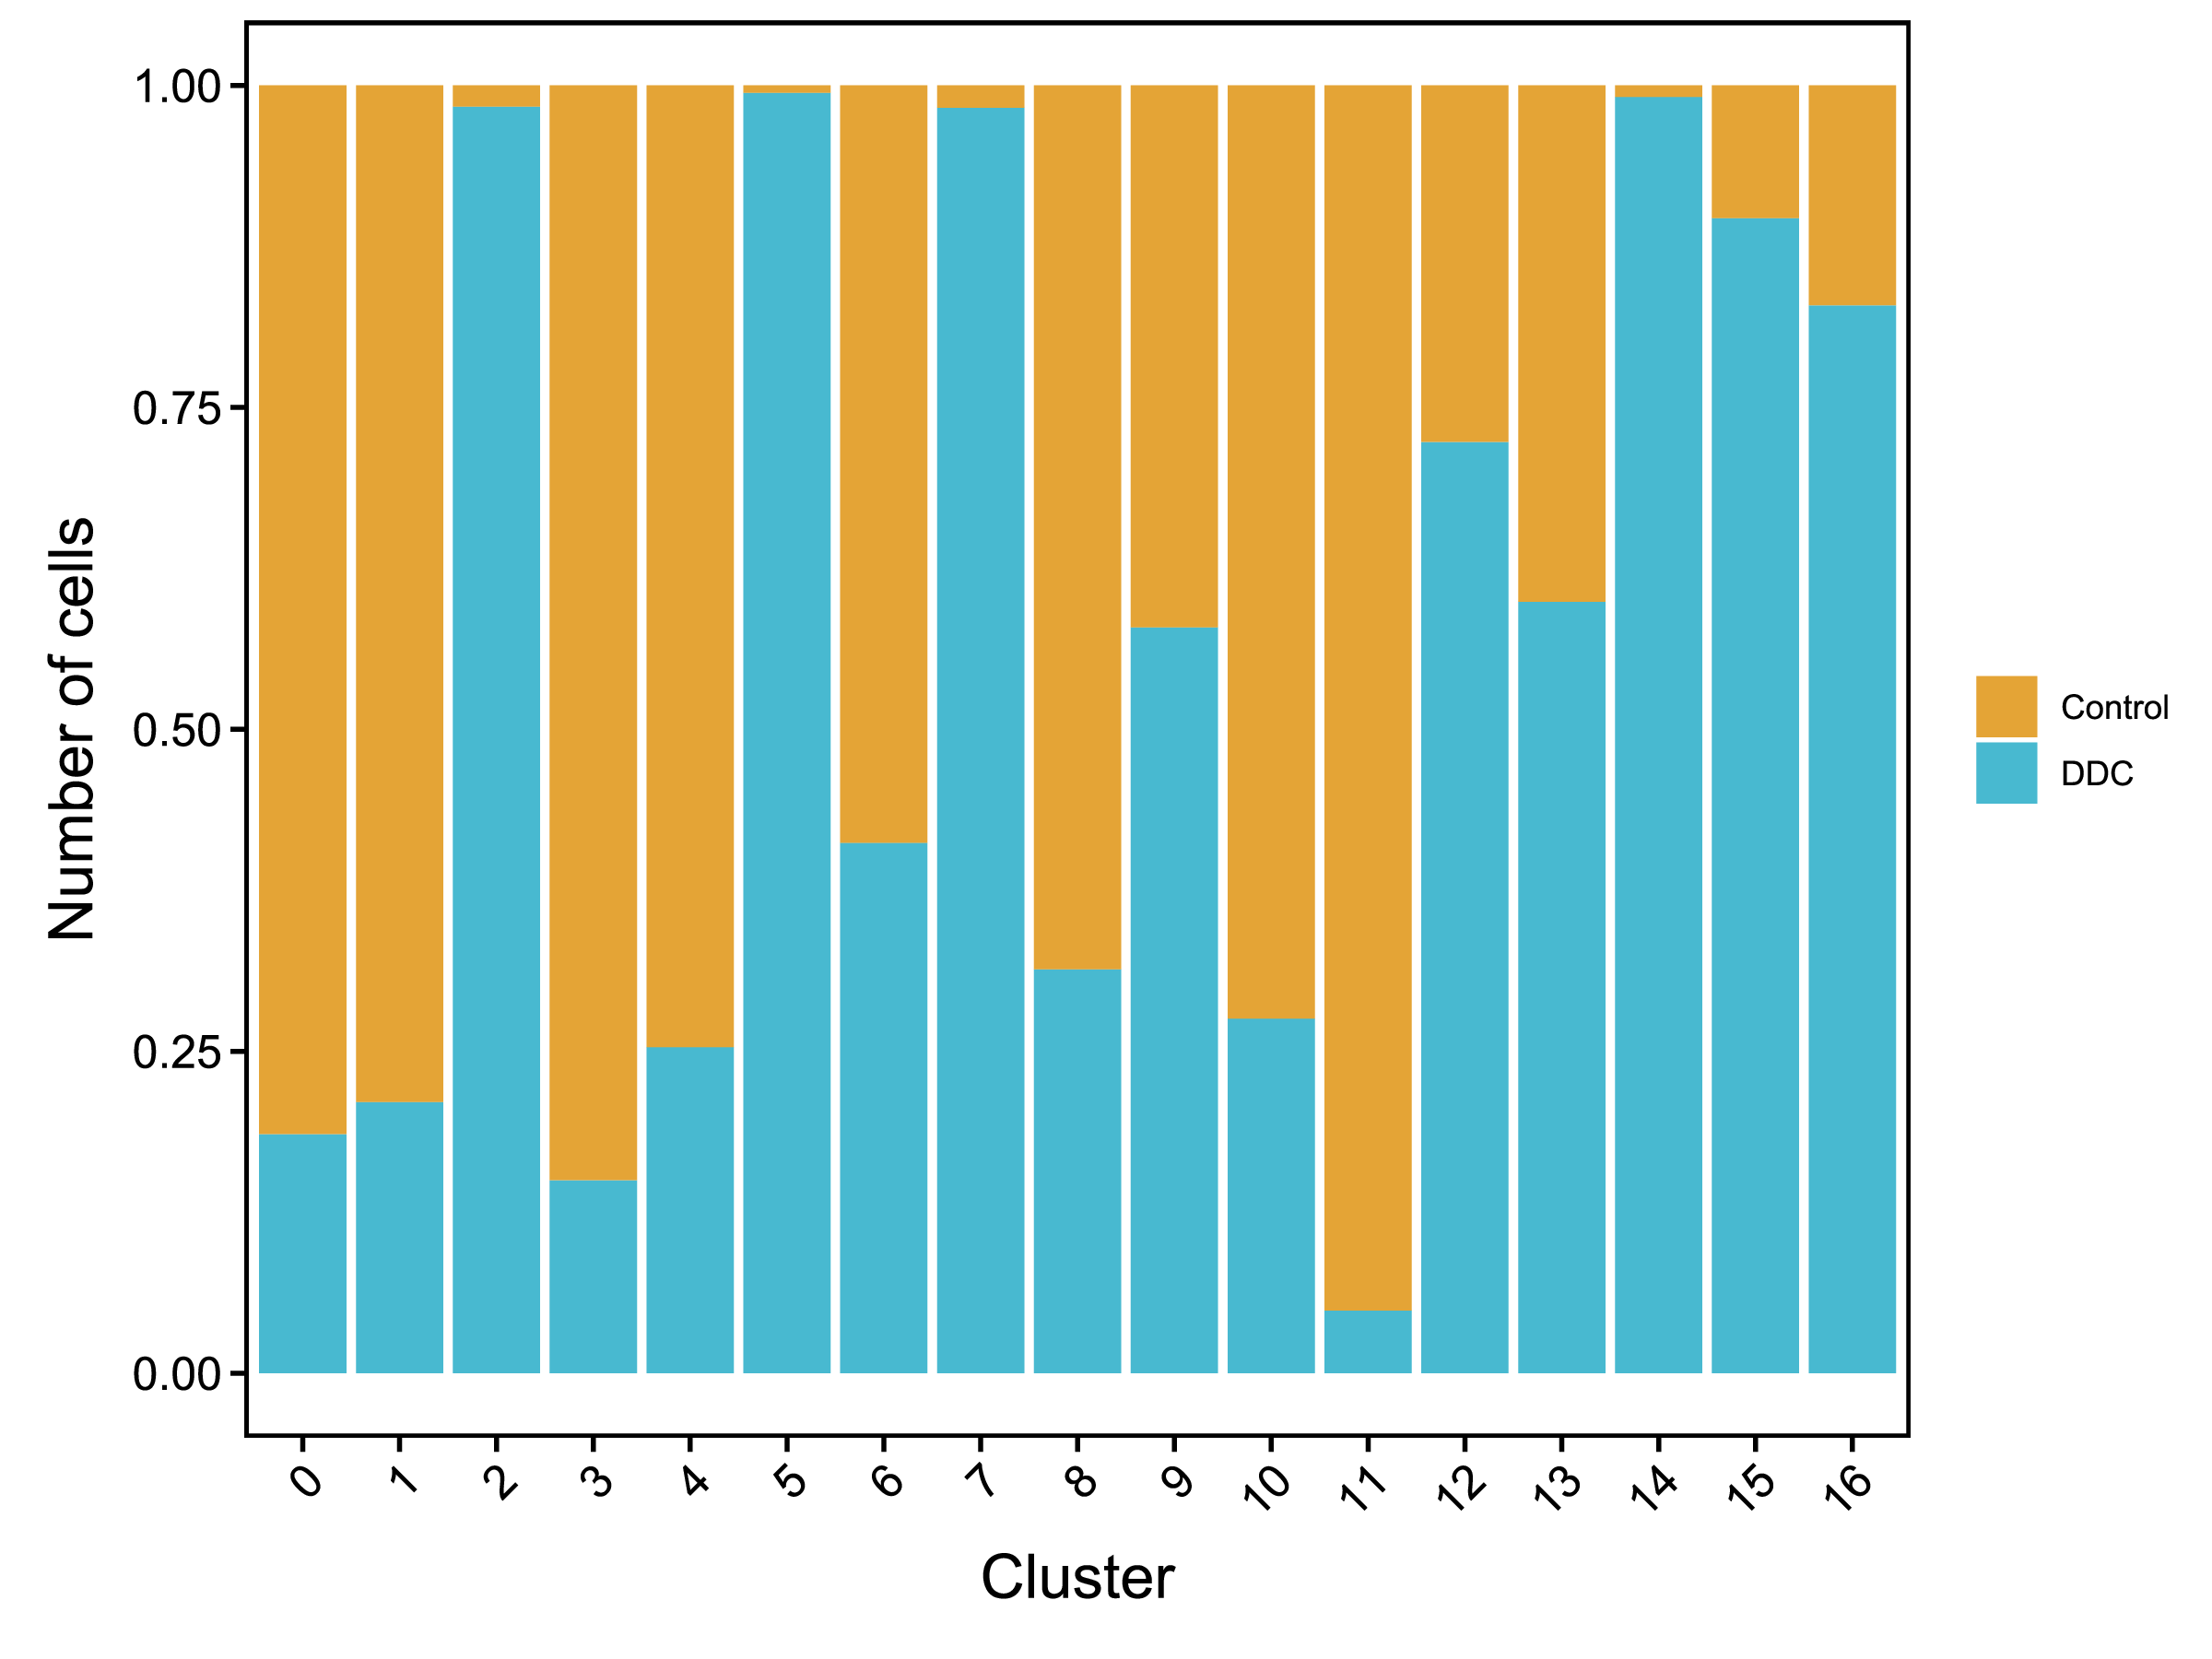
 |
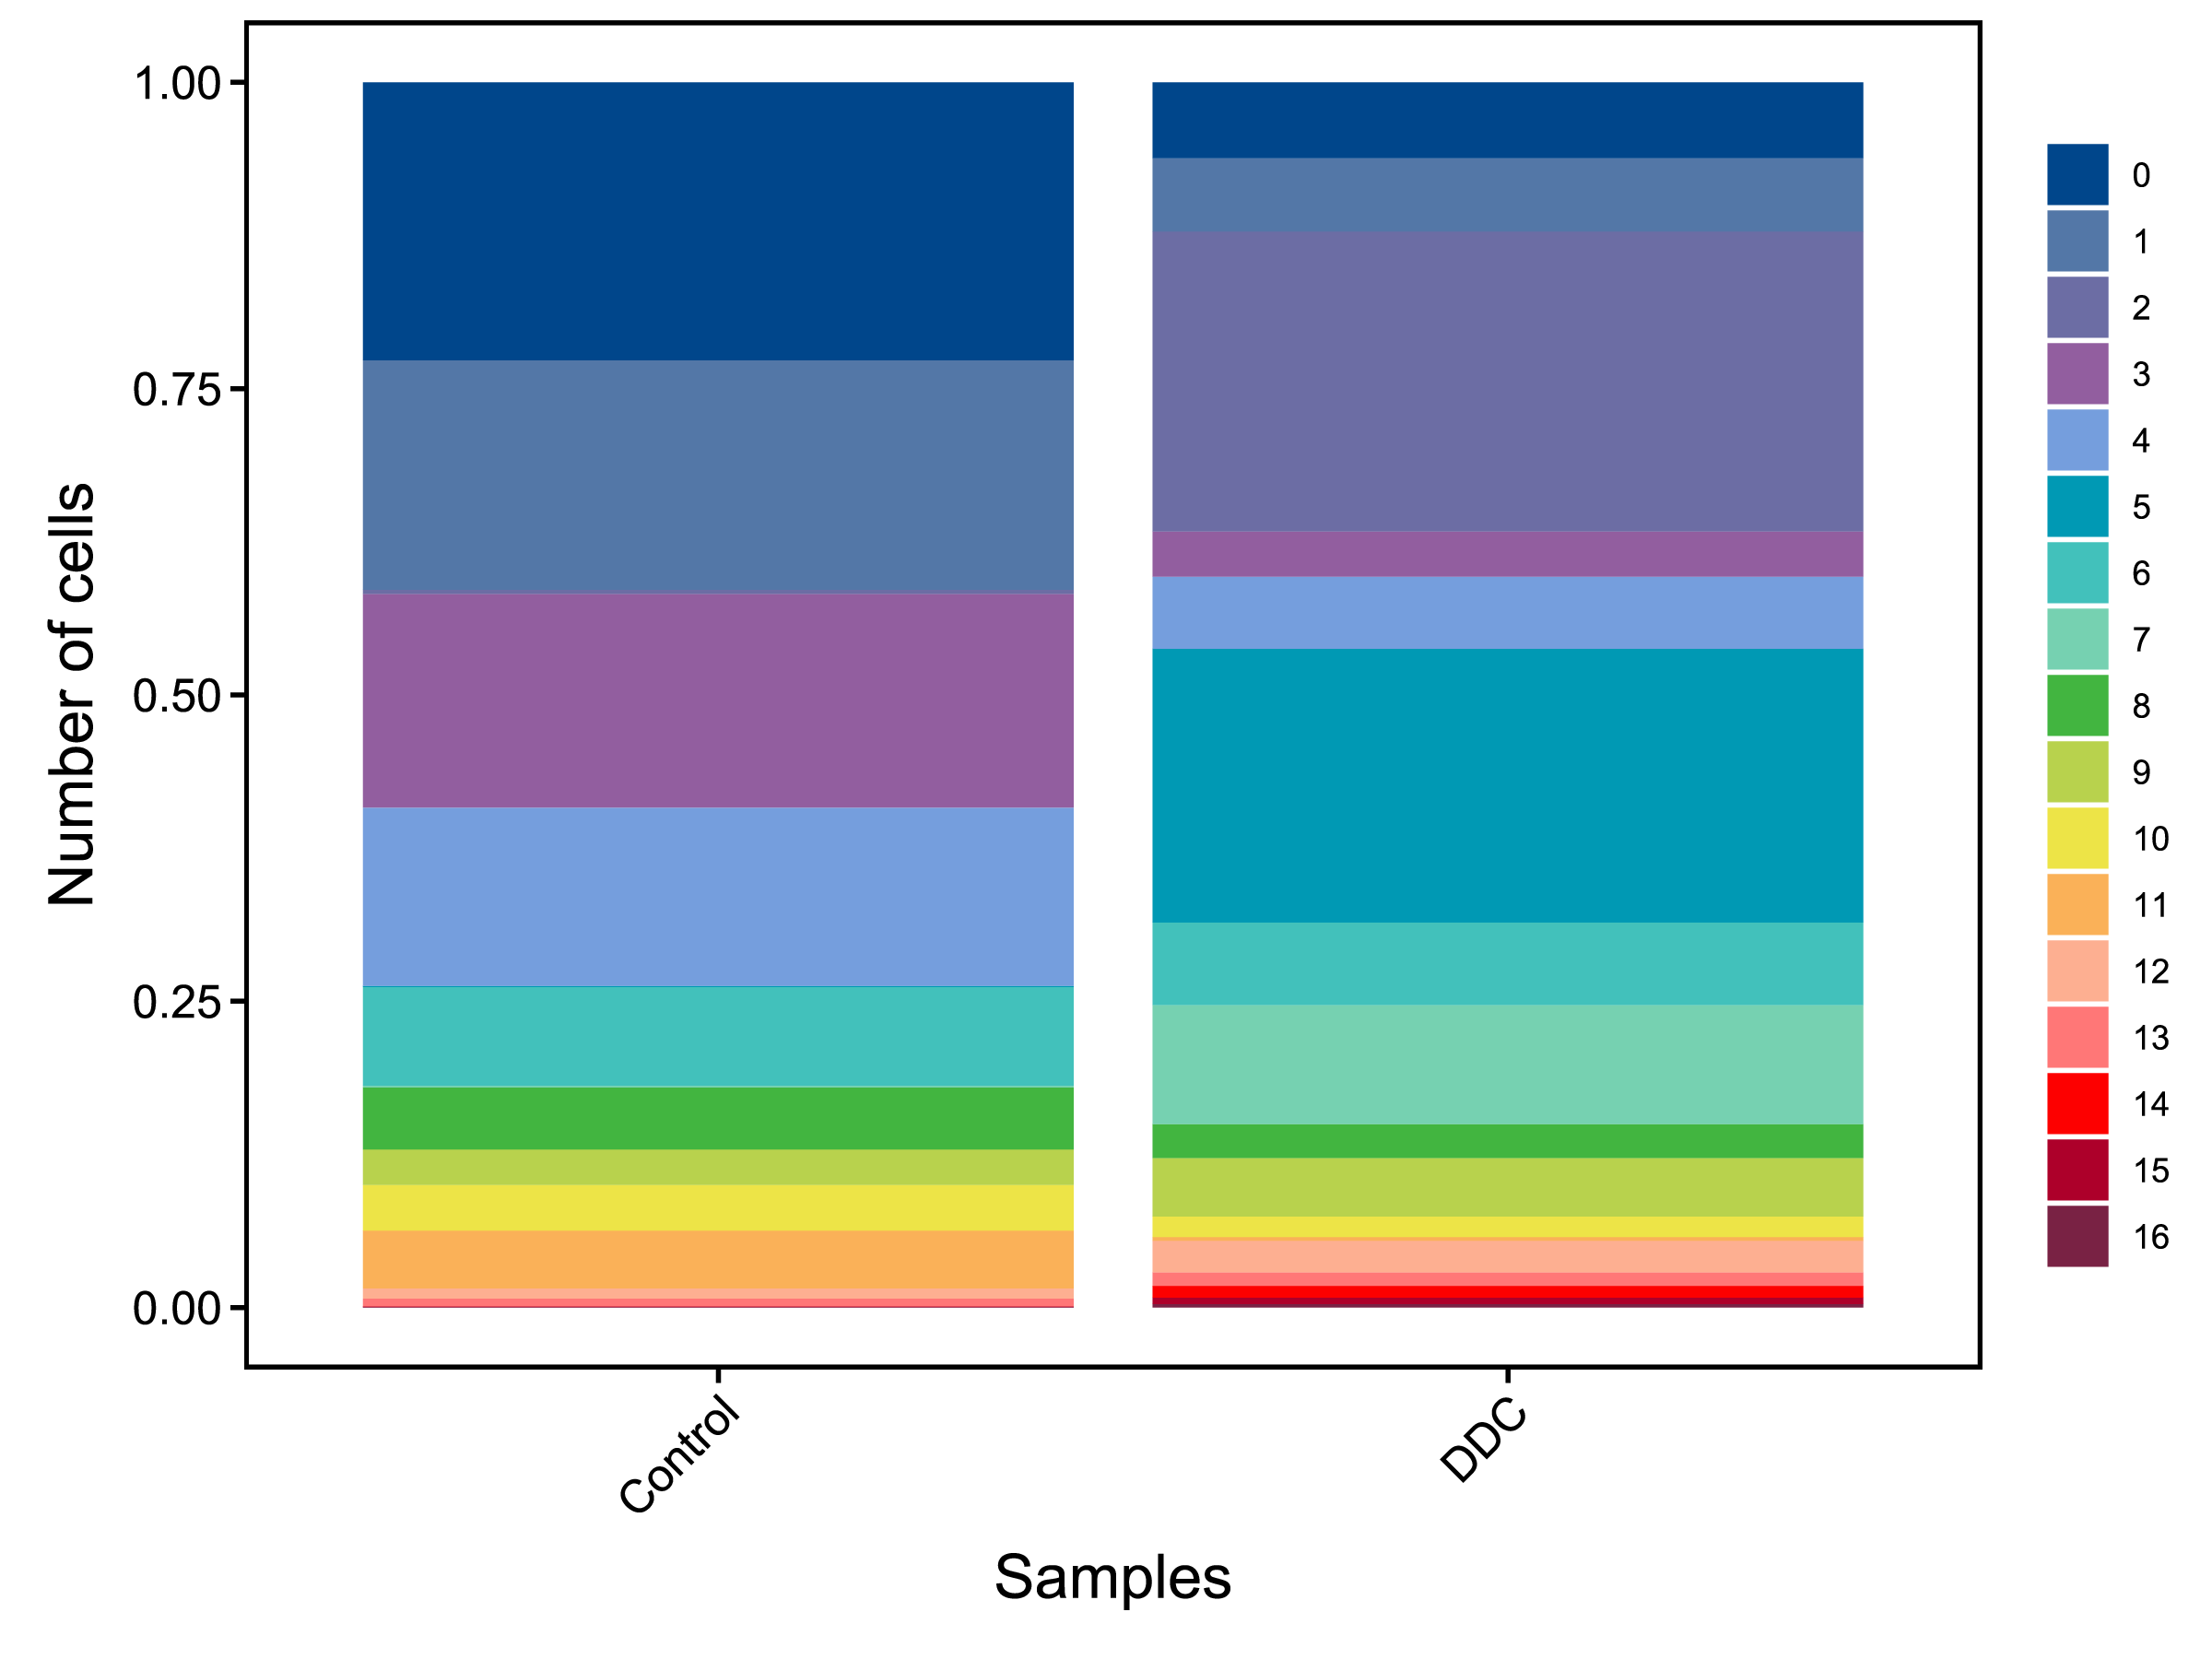 |
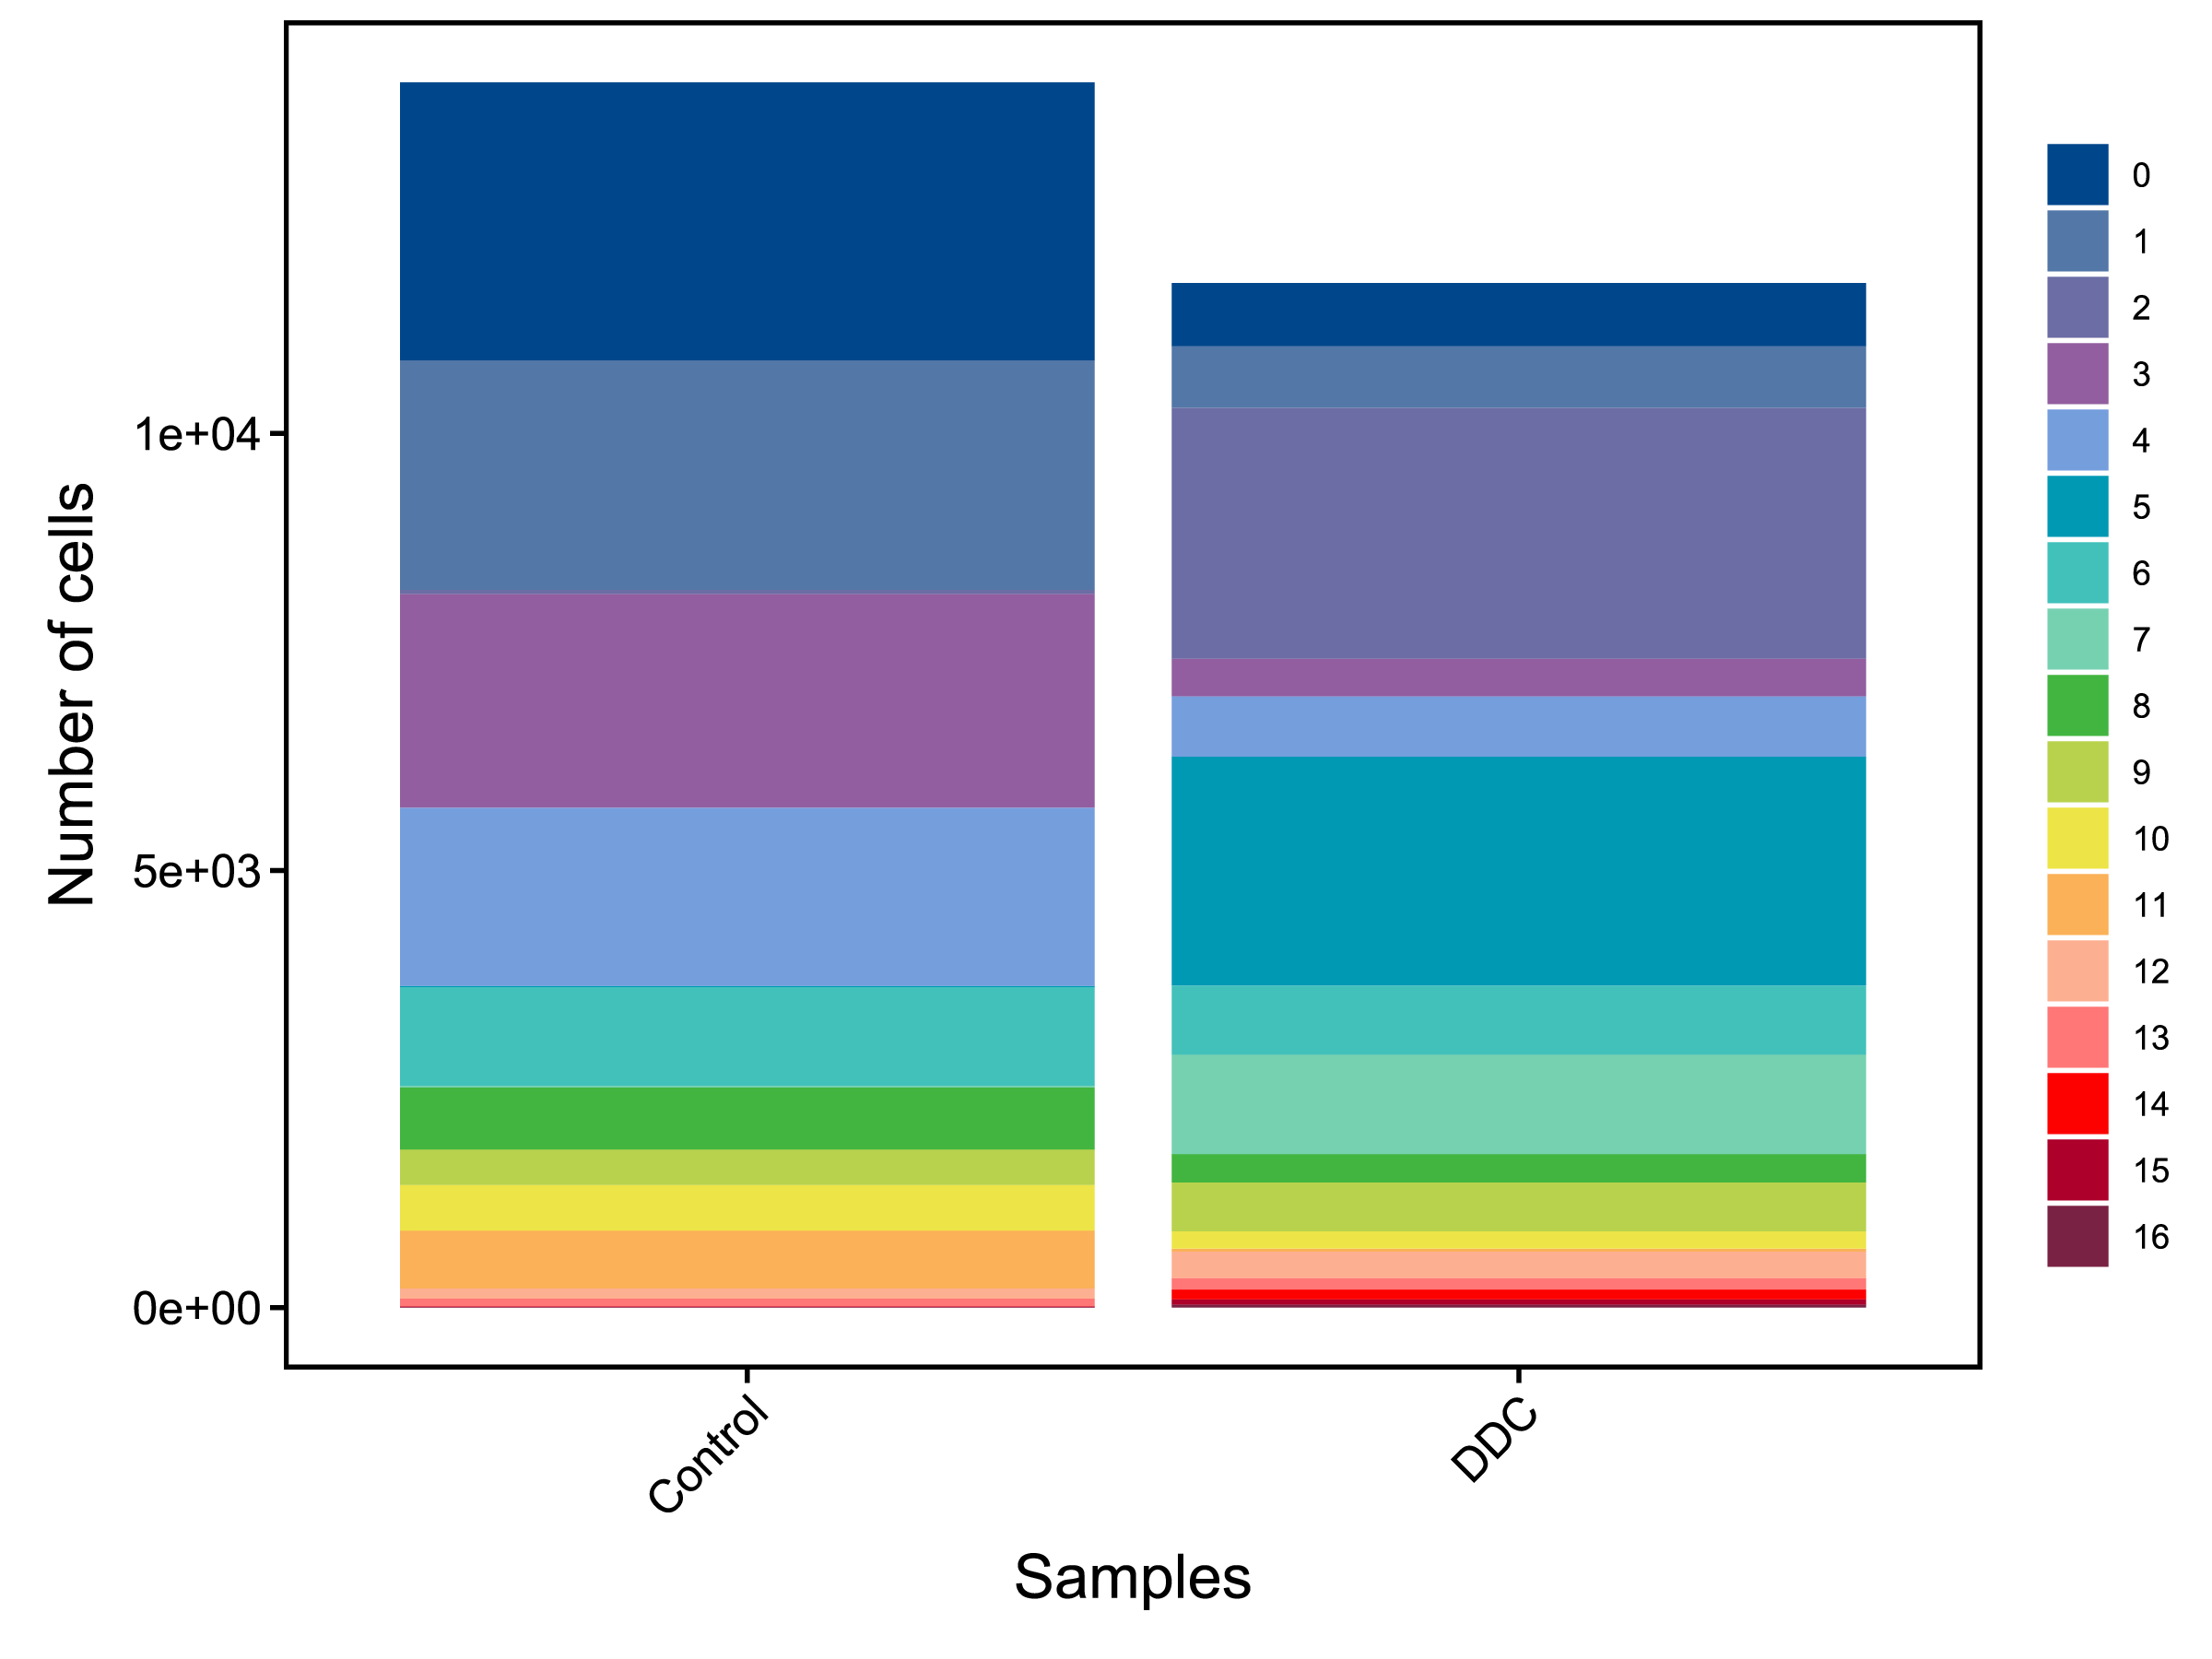
|
| Fig 4-2-1 各样本中各亚群细胞数量堆叠图 | Fig 4-2-2 各样本中各亚群细胞数量百分比堆叠图 | |
 |
 |
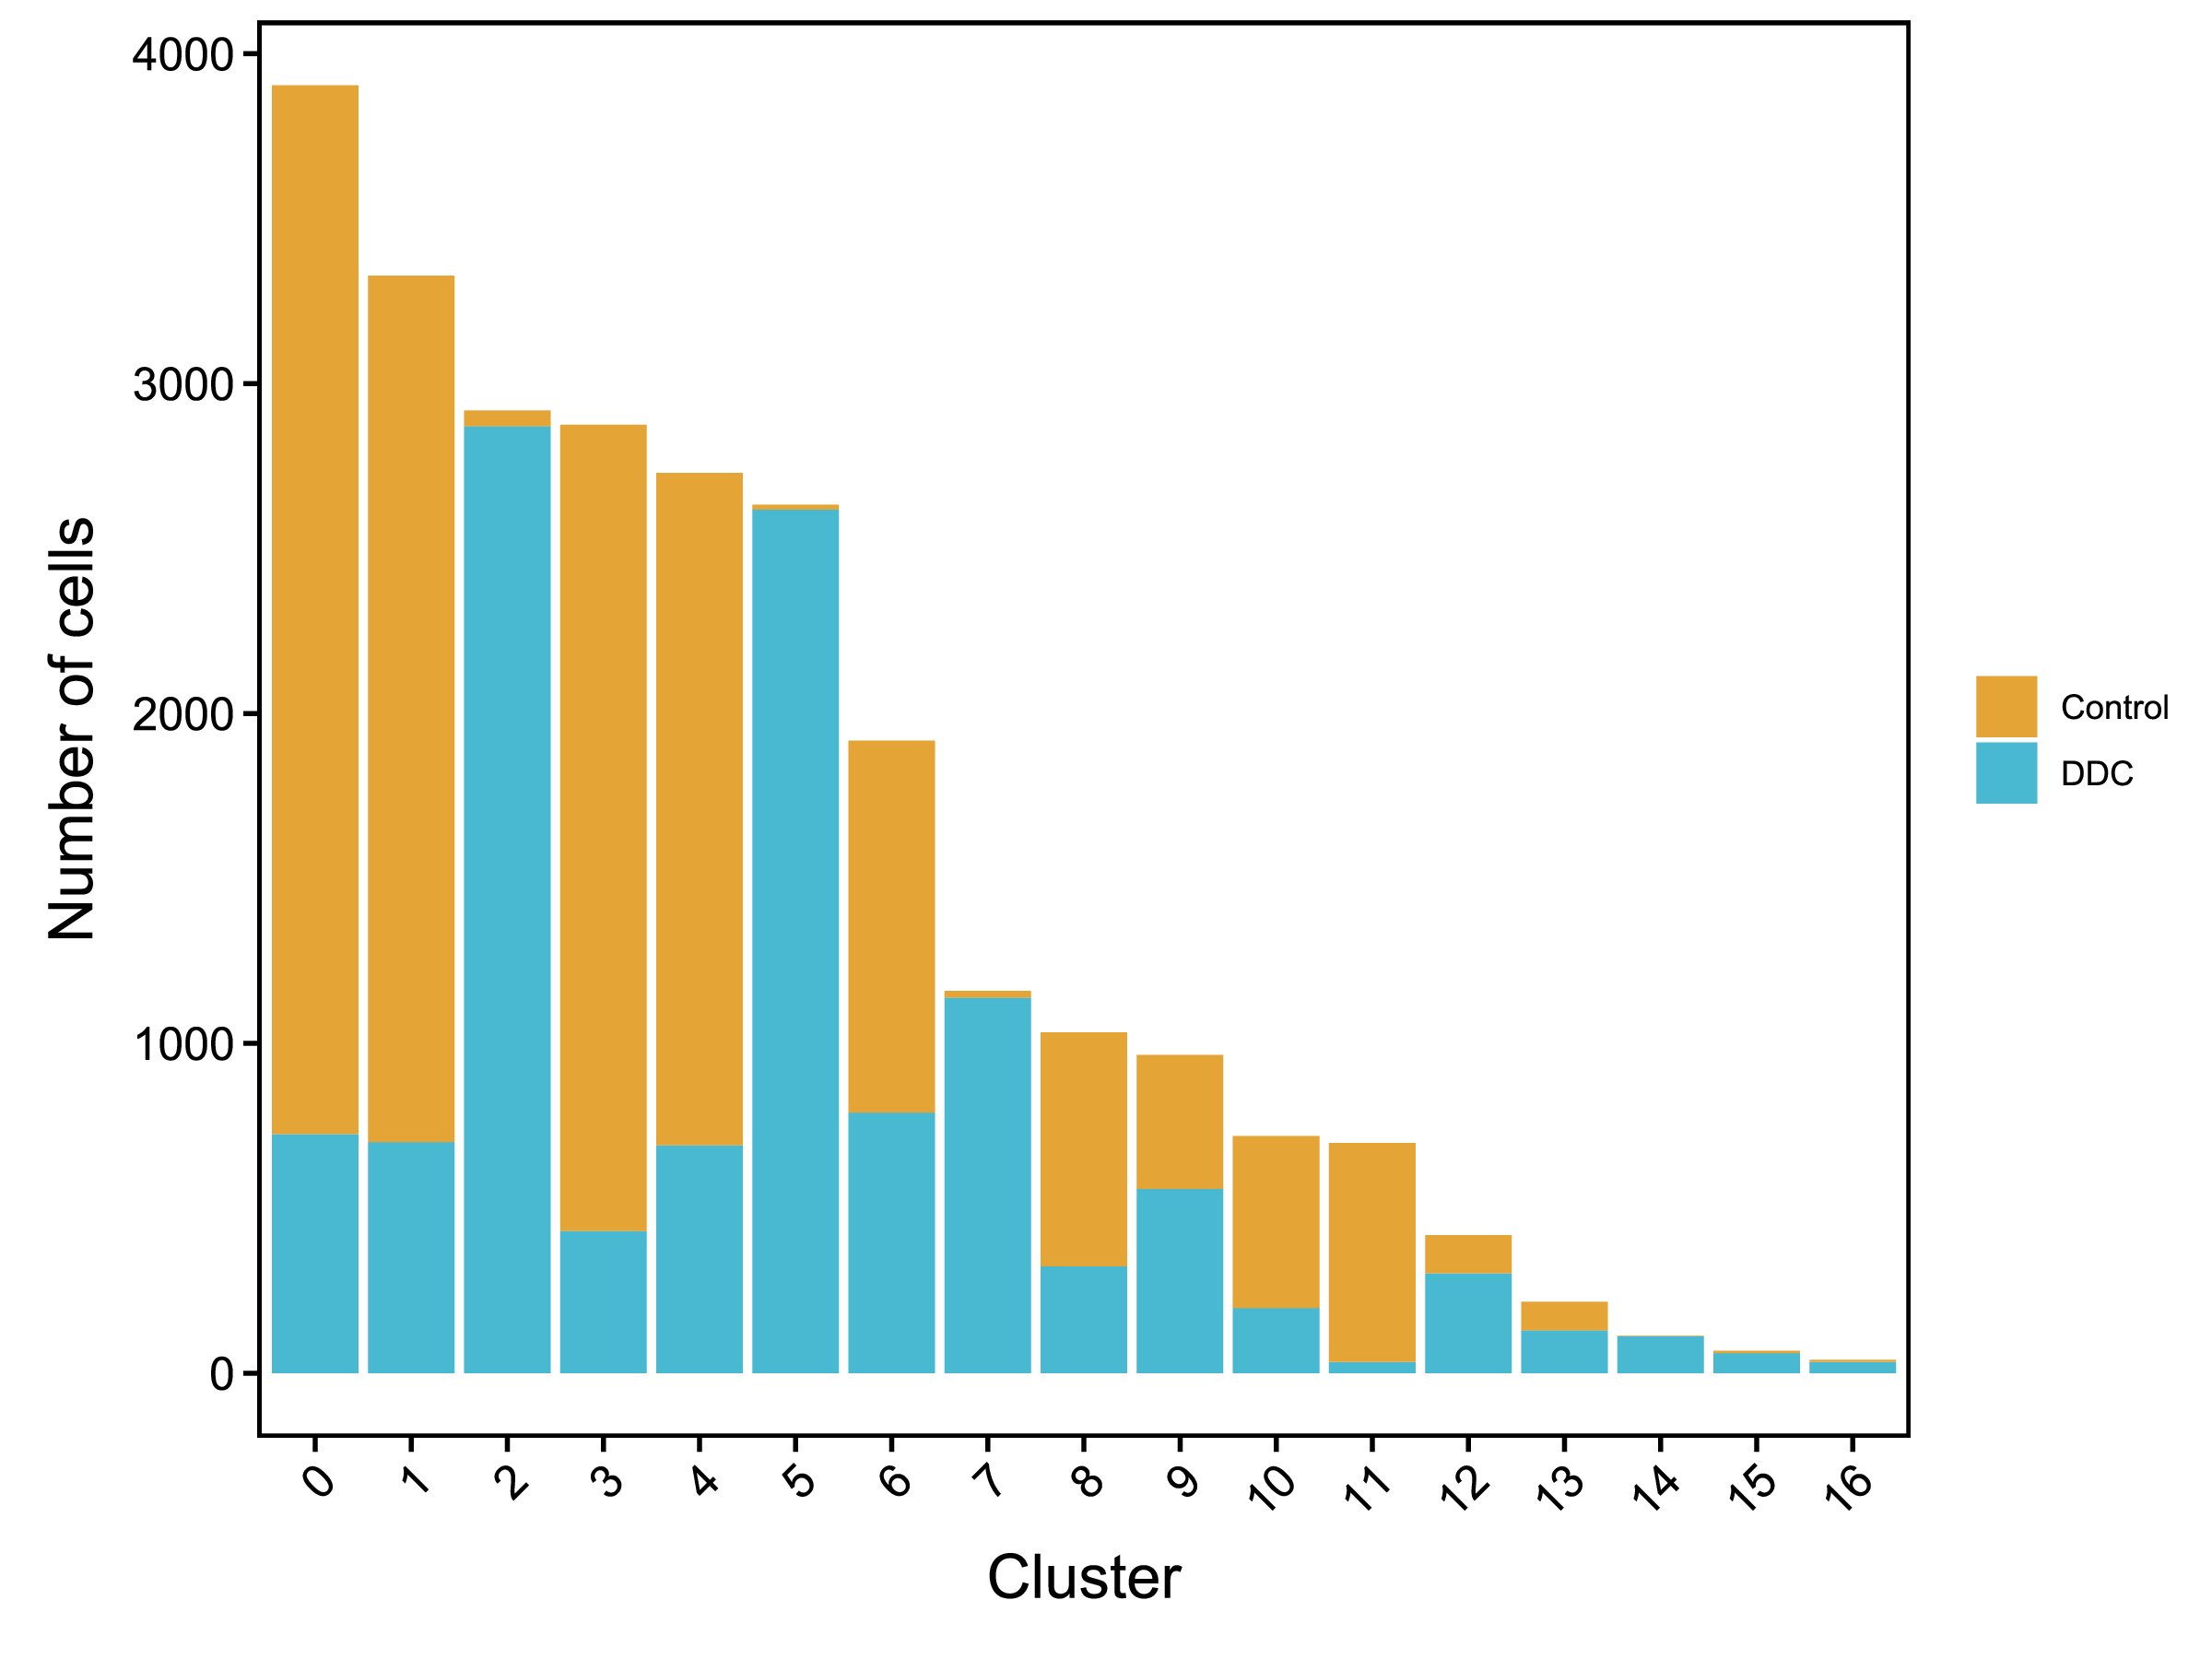
|
| Fig 4-2-3 各亚群中各个样本细胞数量堆叠图 | Fig 4-2-4 各亚群中各个样本细胞数量百分比堆叠图 | |
进一步,我们计算两个细胞亚群之间相关性并绘制成热图。图中具有高度相关性的两个细胞亚群具有比较相似的基因表达模式,可能是同一种细胞类型。这张相关性热图为人工细胞亚群鉴定提供了一定的指导作用。
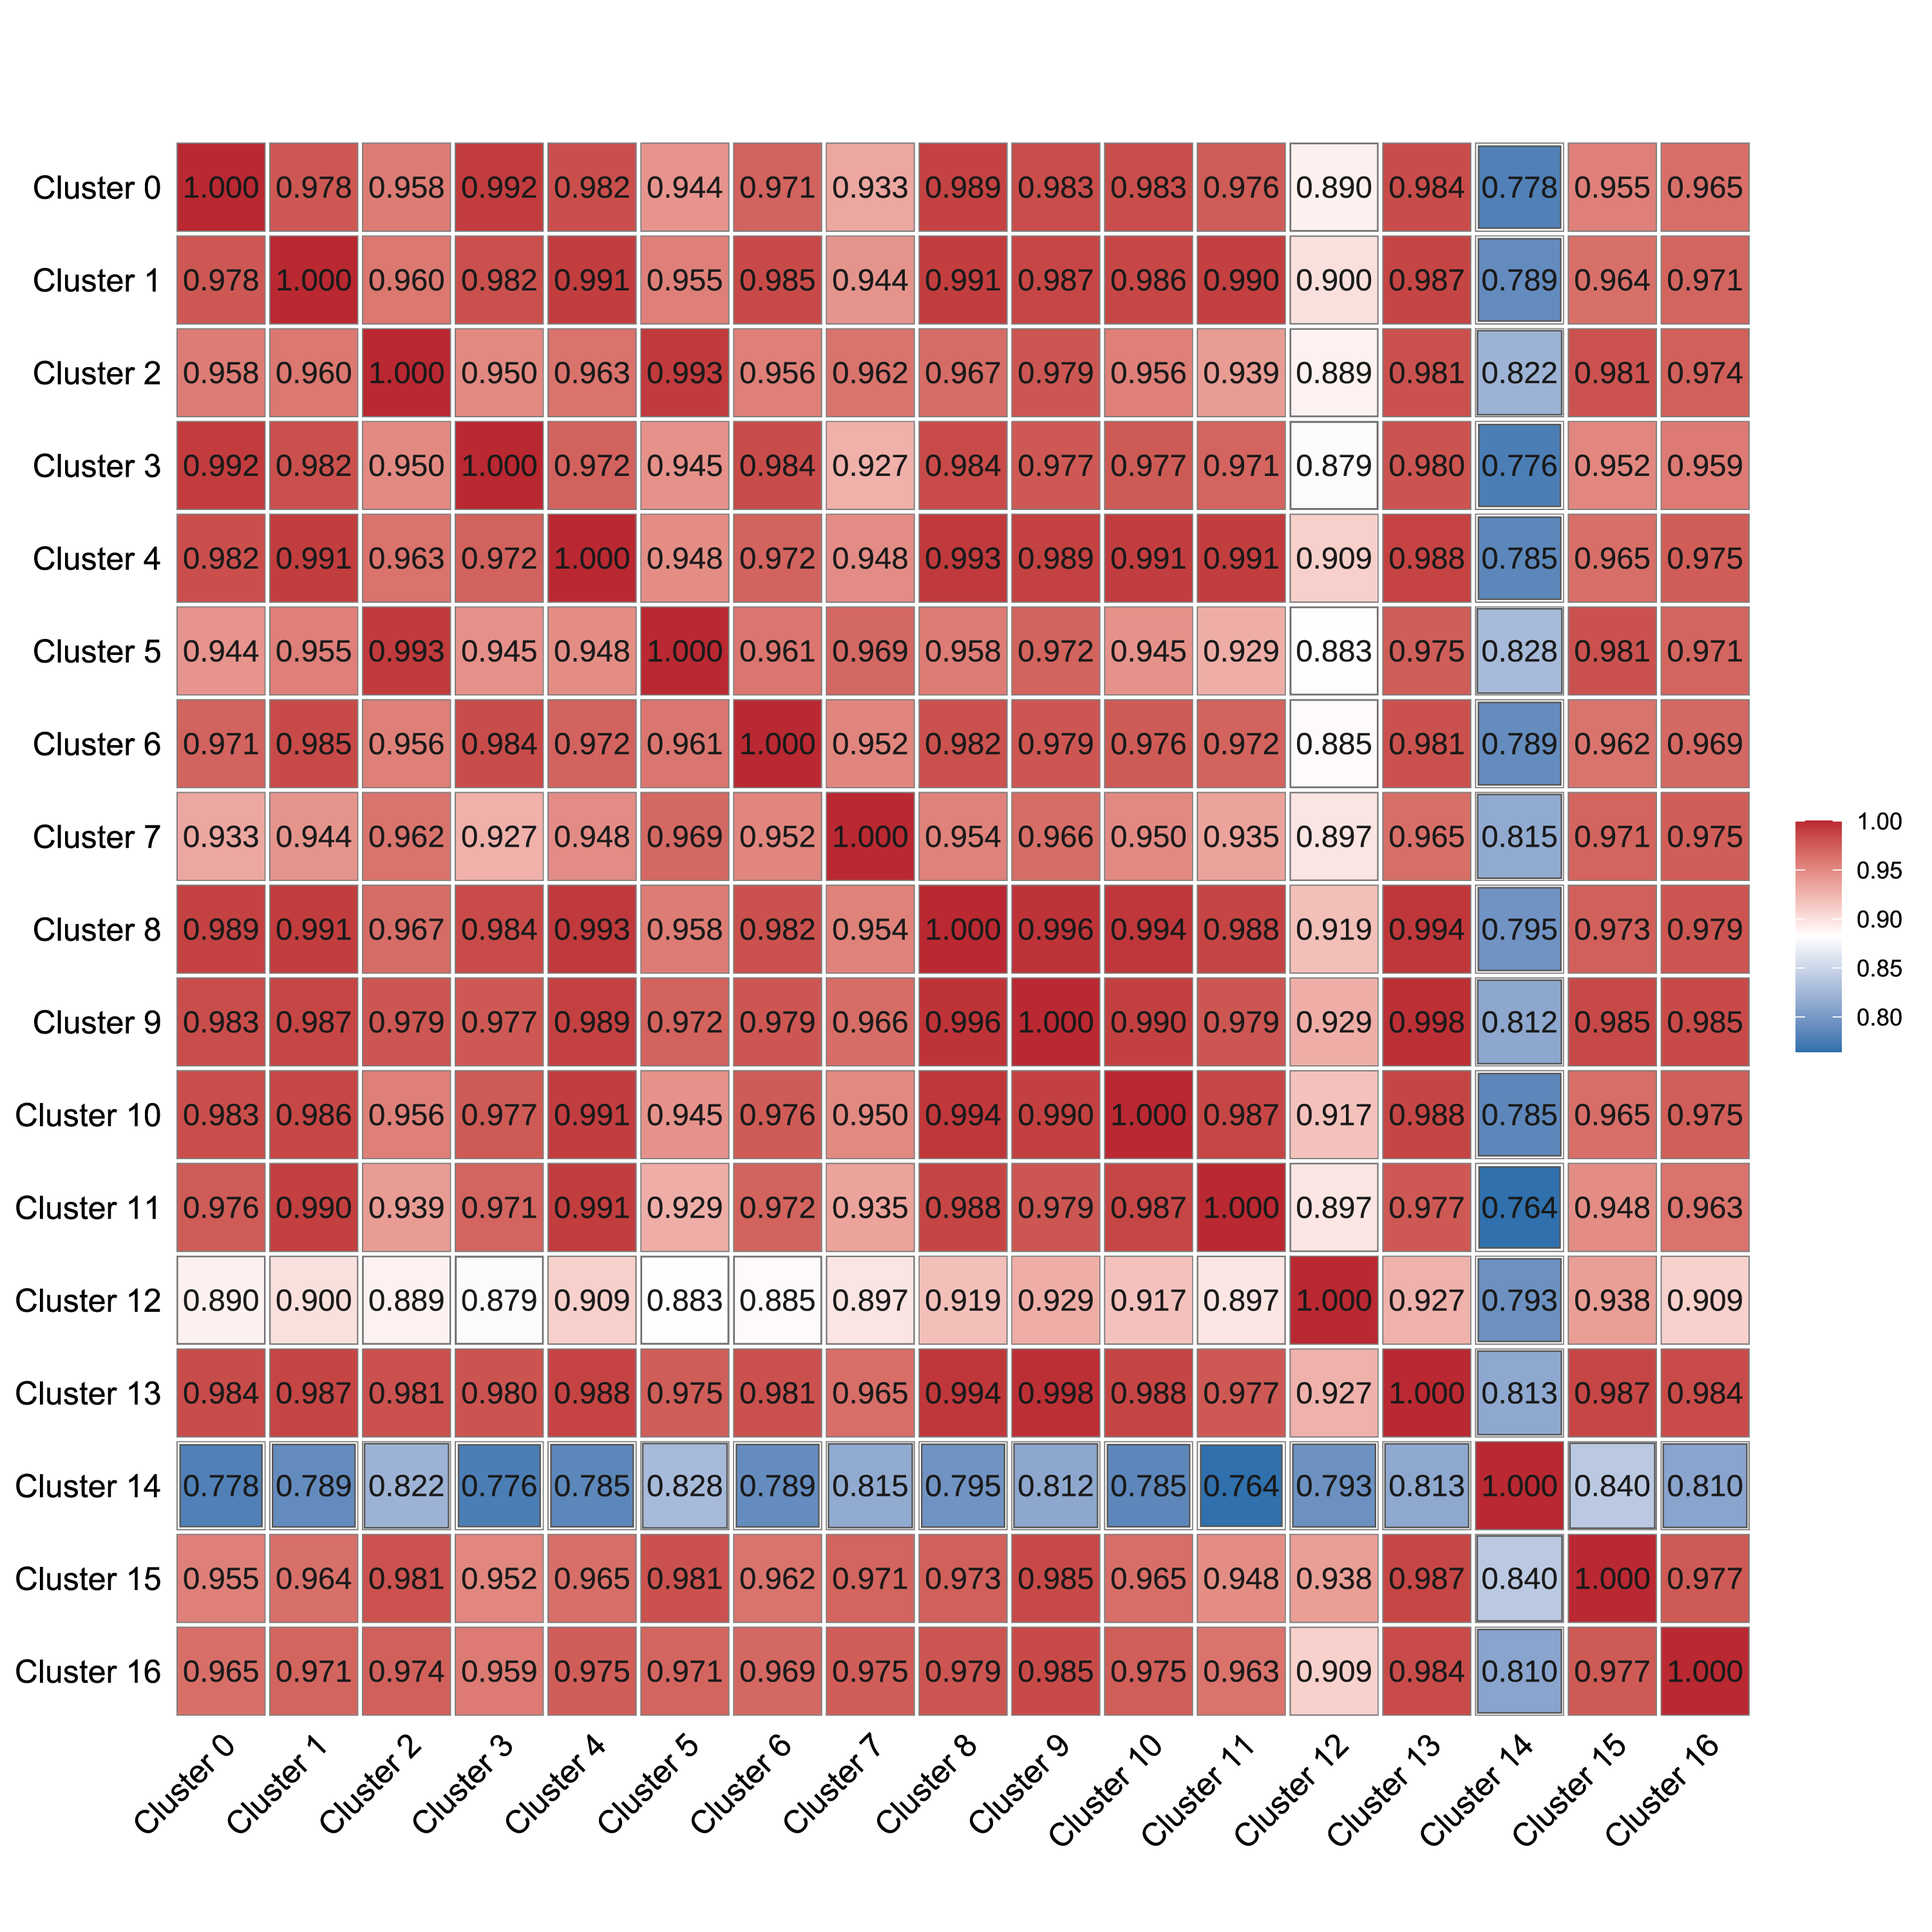 |
| Fig 4-2-5 各亚群相关性热图 |
基因在各个亚群中表达量的均值表:2.Cluster/2.cluster/AllGene.avg_exp.annot.xls
| Gene_ID | Gene_name | Cluster 0 | Cluster 1 | Cluster 2 | Cluster 3 | Cluster 4 | Cluster 5 | Cluster 6 | Cluster 7 | Cluster 8 | Cluster 9 | Cluster 10 | Cluster 11 | Cluster 12 | Cluster 13 | Cluster 14 | Cluster 15 | Cluster 16 | Description | KEGG_A_class | KEGG_B_class | Pathway | K_ID | GO Component | GO Function | GO Process |
|---|---|---|---|---|---|---|---|---|---|---|---|---|---|---|---|---|---|---|---|---|---|---|---|---|---|---|
| ENSMUSG00000051951 | Xkr4 | 0.0289091928559512 | 0.0123170354969991 | 0.018277266918912 | 0.0230340976559192 | 0.0222523756511847 | 0.0250123956449138 | 0.0258956009813497 | 0.113703109936965 | 0.0277522923725781 | 0.0356386845464568 | 0.0336824107111671 | 0.0289825843203452 | 0.547696744532934 | 0.0912295915815388 | 0 | 0 | 0 | X-linked Kx blood group related 4 [Source:MGI Symbol;Acc:MGI:3528744] | - | - | - | - | GO:0005886//plasma membrane;GO:0016020//membrane;GO:0016021//integral component of membrane | GO:0003674//molecular_function | GO:0043652//engulfment of apoptotic cell;GO:0070782//phosphatidylserine exposure on apoptotic cell surface;GO:1902742//apoptotic process involved in development |
| ENSMUSG00000089699 | Gm1992 | 0.00149246727531847 | 0 | 0 | 0 | 0.00183400696409124 | 7.74459442798116e-04 | 6.600537204522e-04 | 0.00206909537081293 | 0 | 0 | 0 | 0 | 0.0131278044272208 | 0 | 0 | 0 | 0 | predicted gene 1992 [Source:MGI Symbol;Acc:MGI:3780162] | - | - | - | - | - | - | - |
| ENSMUSG00000102331 | Gm19938 | 0 | 0 | 0 | 0 | 0 | 0 | 0 | 0 | 0 | 0 | 0 | 0 | 0 | 0 | 0 | 0 | 0 | predicted gene, 19938 [Source:MGI Symbol;Acc:MGI:5012123] | - | - | - | - | - | - | - |
| ENSMUSG00000102343 | Gm37381 | 0 | 0 | 6.54533963309182e-04 | 0 | 9.95746172351713e-04 | 0 | 0 | 0.00477579654099477 | 0 | 0 | 0 | 0 | 0.00355418443018427 | 0 | 0 | 0 | 0 | predicted gene, 37381 [Source:MGI Symbol;Acc:MGI:5610609] | - | - | - | - | - | - | - |
| ENSMUSG00000025900 | Rp1 | 0.00577808063043053 | 0.0104108946448628 | 0.00907040461980564 | 0.00738808383106026 | 0.0107622727304009 | 0.00808585338011308 | 0.00973967498790316 | 0.00783912294075389 | 0.00758838411893138 | 0.0120271339337693 | 0.01717030235531 | 0.00618479234932208 | 0.0223960709597719 | 0.00934935064085124 | 0 | 0 | 0 | retinitis pigmentosa 1 (human) [Source:MGI Symbol;Acc:MGI:1341105] | - | - | - | - | GO:0001750//photoreceptor outer segment;GO:0001917//photoreceptor inner segment;GO:0005737//cytoplasm;GO:0005856//cytoskeleton;GO:0005875//microtubule associated complex;GO:0005929//cilium;GO:0005930//axoneme;GO:0032391//photoreceptor connecting cilium;GO:0042995//cell projection;GO:0097542//ciliary tip | GO:0004096//catalase activity;GO:0005515//protein binding;GO:0008017//microtubule binding;GO:0020037//heme binding | GO:0007026//negative regulation of microtubule depolymerization;GO:0007601//visual perception;GO:0030030//cell projection organization;GO:0035082//axoneme assembly;GO:0035556//intracellular signal transduction;GO:0035845//photoreceptor cell outer segment organization;GO:0042461//photoreceptor cell development;GO:0045494//photoreceptor cell maintenance;GO:0046548//retinal rod cell development;GO:0046549//retinal cone cell development;GO:0046785//microtubule polymerization;GO:0050896//response to stimulus;GO:0055114//oxidation-reduction process;GO:0060041//retina development in camera-type eye;GO:0060042//retina morphogenesis in camera-type eye;GO:0071482//cellular response to light stimulus;GO:0098869//cellular oxidant detoxification;GO:1902857//positive regulation of nonmotile primary cilium assembly |
| ENSMUSG00000025902 | Sox17 | 0.00398817797539257 | 0.00890776200541436 | 0.00238419074527191 | 0.00281738626448148 | 0.00836296633258891 | 0.00769816833486431 | 0.00863516943374317 | 0.00278686295099803 | 0.257721819374139 | 0.0175599095489489 | 0.0178925096960499 | 0.00362791784362368 | 0.018940867856976 | 0 | 0 | 0 | 0 | SRY (sex determining region Y)-box 17 [Source:MGI Symbol;Acc:MGI:107543] | Environmental Information Processing | Signal transduction | ko04310//Wnt signaling pathway | K04495 | GO:0005634//nucleus;GO:0005667//transcription factor complex;GO:0044798//nuclear transcription factor complex | GO:0000981//RNA polymerase II transcription factor activity, sequence-specific DNA binding;GO:0001228//transcriptional activator activity, RNA polymerase II transcription regulatory region sequence-specific binding;GO:0003677//DNA binding;GO:0003700//transcription factor activity, sequence-specific DNA binding;GO:0003713//transcription coactivator activity;GO:0005515//protein binding;GO:0008013//beta-catenin binding;GO:0008134//transcription factor binding;GO:0043565//sequence-specific DNA binding;GO:0044212//transcription regulatory region DNA binding | GO:0001525//angiogenesis;GO:0001570//vasculogenesis;GO:0001656//metanephros development;GO:0001706//endoderm formation;GO:0001828//inner cell mass cellular morphogenesis;GO:0001947//heart looping;GO:0003142//cardiogenic plate morphogenesis;GO:0003143//embryonic heart tube morphogenesis;GO:0003151//outflow tract morphogenesis;GO:0003308//negative regulation of Wnt signaling pathway involved in heart development;GO:0006355//regulation of transcription, DNA-templated;GO:0007283//spermatogenesis;GO:0007369//gastrulation;GO:0007492//endoderm development;GO:0007493//endodermal cell fate determination;GO:0010628//positive regulation of gene expression;GO:0016055//Wnt signaling pathway;GO:0021903//rostrocaudal neural tube patterning;GO:0023019//signal transduction involved in regulation of gene expression;GO:0030154//cell differentiation;GO:0030178//negative regulation of Wnt signaling pathway;GO:0030308//negative regulation of cell growth;GO:0031648//protein destabilization;GO:0035050//embryonic heart tube development;GO:0042074//cell migration involved in gastrulation;GO:0042789//mRNA transcription from RNA polymerase II promoter;GO:0045595//regulation of cell differentiation;GO:0045597//positive regulation of cell differentiation;GO:0045732//positive regulation of protein catabolic process;GO:0045893//positive regulation of transcription, DNA-templated;GO:0045944//positive regulation of transcription from RNA polymerase II promoter;GO:0045995//regulation of embryonic development;GO:0048568//embryonic organ development;GO:0048617//embryonic foregut morphogenesis;GO:0048863//stem cell differentiation;GO:0048866//stem cell fate specification;GO:0050821//protein stabilization;GO:0060214//endocardium formation;GO:0060807//regulation of transcription from RNA polymerase II promoter involved in definitive endodermal cell fate specification;GO:0060913//cardiac cell fate determination;GO:0060956//endocardial cell differentiation;GO:0061009//common bile duct development;GO:0061010//gall bladder development;GO:0061031//endodermal digestive tract morphogenesis;GO:0072091//regulation of stem cell proliferation;GO:0072189//ureter development;GO:0090090//negative regulation of canonical Wnt signaling pathway;GO:1990830//cellular response to leukemia inhibitory factor;GO:2000035//regulation of stem cell division;GO:2000043//regulation of cardiac cell fate specification |
| ENSMUSG00000104238 | Gm37587 | 0 | 0 | 0 | 0 | 0 | 0 | 0 | 0 | 0.00363278656706705 | 0 | 0 | 0 | 0 | 0 | 0 | 0 | 0 | predicted gene, 37587 [Source:MGI Symbol;Acc:MGI:5610815] | - | - | - | - | - | - | - |
| ENSMUSG00000104328 | Gm37323 | 0 | 0 | 0 | 0 | 0 | 0 | 0 | 0 | 0 | 0 | 0 | 0 | 0 | 0 | 0 | 0 | 0 | predicted gene, 37323 [Source:MGI Symbol;Acc:MGI:5610551] | - | - | - | - | - | - | - |
| ENSMUSG00000033845 | Mrpl15 | 0.439605221389018 | 0.414788056062646 | 0.496838654189676 | 0.401953144218129 | 0.382751562803596 | 0.526090301209409 | 0.455465447650494 | 0.333622634188695 | 0.467251536928575 | 0.432062483245218 | 0.377315922913335 | 0.402859059658817 | 0.422982917448395 | 0.361455209605916 | 0.636771807226592 | 0.407058212029362 | 0.607850833082405 | mitochondrial ribosomal protein L15 [Source:MGI Symbol;Acc:MGI:1351639] | Genetic Information Processing | Translation | ko03010//Ribosome | K02876 | GO:0005739//mitochondrion;GO:0005762//mitochondrial large ribosomal subunit;GO:0005840//ribosome;GO:0015934//large ribosomal subunit | GO:0003735//structural constituent of ribosome | GO:0000002//mitochondrial genome maintenance;GO:0006412//translation;GO:1990830//cellular response to leukemia inhibitory factor |
| ENSMUSG00000025903 | Lypla1 | 0 | 0 | 0.0017077906272719 | 0.00147001203397684 | 0.00140307777208238 | 6.85921818219606e-04 | 0.0062547989817879 | 0 | 0 | 0.00294729644497103 | 0 | 0.00943858610354277 | 0 | 0 | 0 | 0 | 0 | lysophospholipase 1 [Source:MGI Symbol;Acc:MGI:1344588] | Human Diseases;Metabolism | Cancers;Lipid metabolism | ko05231//Choline metabolism in cancer;ko00564//Glycerophospholipid metabolism | K06128;K06128 | GO:0005737//cytoplasm;GO:0005739//mitochondrion;GO:0005829//cytosol | GO:0004622//lysophospholipase activity;GO:0008474//palmitoyl-(protein) hydrolase activity;GO:0016298//lipase activity;GO:0016787//hydrolase activity;GO:0052689//carboxylic ester hydrolase activity | GO:0002084//protein depalmitoylation;GO:0006629//lipid metabolic process;GO:0006631//fatty acid metabolic process;GO:0042997//negative regulation of Golgi to plasma membrane protein transport |
| ENSMUSG00000104217 | Gm37988 | 0.254058939248073 | 0.22839248818855 | 0.241018505512605 | 0.238231812712469 | 0.229939932393601 | 0.20522694816823 | 0.207910496946485 | 0.122036587053964 | 0.189215825826038 | 0.227557396726703 | 0.101624043017141 | 0.239206230310767 | 0.18186692537434 | 0.166140903419052 | 0.14277121916387 | 0.339444913303096 | 0.337666406382047 | predicted gene, 37988 [Source:MGI Symbol;Acc:MGI:5611216] | - | - | - | - | - | - | - |
| ENSMUSG00000033813 | Tcea1 | 0.258175172001122 | 0.241464038450691 | 0.274901022272709 | 0.207633067357096 | 0.273107481009368 | 0.227227534166344 | 0.255342678647703 | 0.224044310738187 | 0.212036535949402 | 0.271944088319209 | 0.274890254405097 | 0.19555200759539 | 0.222269018691106 | 0.252720464642034 | 0.222647889662028 | 0.155153983097667 | 0.377301561235658 | transcription elongation factor A (SII) 1 [Source:MGI Symbol;Acc:MGI:1196624] | - | - | - | - | GO:0005634//nucleus;GO:0005654//nucleoplasm;GO:0005669//transcription factor TFIID complex;GO:0005730//nucleolus | GO:0003676//nucleic acid binding;GO:0003677//DNA binding;GO:0005515//protein binding;GO:0008270//zinc ion binding;GO:0046872//metal ion binding | GO:0006351//transcription, DNA-templated;GO:0006355//regulation of transcription, DNA-templated;GO:0030218//erythrocyte differentiation;GO:0045893//positive regulation of transcription, DNA-templated;GO:0045944//positive regulation of transcription from RNA polymerase II promoter;GO:1901919//positive regulation of exoribonuclease activity |
| ENSMUSG00000002459 | Rgs20 | 0.0136974933303658 | 0.0212256267258837 | 0.0171306715247617 | 0.0141527575032187 | 0.0228712814149992 | 0.00775019335925224 | 0.00741336657686429 | 0.0251836944338194 | 0.0203499112930535 | 0.0196360313382331 | 0.0300268351741564 | 0.0239248183605551 | 0.0362913729481989 | 0 | 0 | 0 | 0 | regulator of G-protein signaling 20 [Source:MGI Symbol;Acc:MGI:1929866] | - | - | - | - | GO:0005634//nucleus;GO:0005737//cytoplasm;GO:0005794//Golgi apparatus;GO:0005802//trans-Golgi network;GO:0016020//membrane | GO:0005096//GTPase activator activity | GO:0007186//G-protein coupled receptor signaling pathway;GO:0009968//negative regulation of signal transduction;GO:0043547//positive regulation of GTPase activity |
| ENSMUSG00000085623 | Gm16041 | 0 | 0 | 0 | 0 | 0 | 0 | 0 | 0 | 0 | 0 | 0 | 0 | 0 | 0 | 0 | 0 | 0 | predicted gene 16041 [Source:MGI Symbol;Acc:MGI:3801909] | - | - | - | - | - | - | - |
| ENSMUSG00000033793 | Atp6v1h | 0.576201693066842 | 0.560918035380835 | 0.790195215279022 | 0.644682302873742 | 0.605625019563176 | 0.820060433848386 | 0.79878486631661 | 1.05142685992283 | 0.64606510728066 | 0.681616052419647 | 0.735159137474344 | 0.547241687578188 | 0.763766253653017 | 0.631494473961657 | 0.636947104900866 | 0.809377601387021 | 0.644650343075006 | ATPase, H+ transporting, lysosomal V1 subunit H [Source:MGI Symbol;Acc:MGI:1914864] | Metabolism;Human Diseases;Human Diseases;Cellular Processes;Environmental Information Processing;Metabolism;Cellular Processes;Human Diseases;Organismal Systems | Global and overview maps;Infectious diseases;Infectious diseases;Transport and catabolism;Signal transduction;Energy metabolism;Transport and catabolism;Immune diseases;Nervous system | ko01100//Metabolic pathways;ko05165//Human papillomavirus infection;ko05152//Tuberculosis;ko04145//Phagosome;ko04150//mTOR signaling pathway;ko00190//Oxidative phosphorylation;ko04142//Lysosome;ko05323//Rheumatoid arthritis;ko04721//Synaptic vesicle cycle | K02144;K02144;K02144;K02144;K02144;K02144;K02144;K02144;K02144 | GO:0000221//vacuolar proton-transporting V-type ATPase, V1 domain | GO:0046961//proton-transporting ATPase activity, rotational mechanism | GO:0006811//ion transport;GO:0006897//endocytosis;GO:1902600//hydrogen ion transmembrane transport |
| ENSMUSG00000025905 | Oprk1 | 0 | 0 | 0 | 0 | 5.50119488703544e-04 | 0 | 0.00129566708197116 | 0 | 0.00413345094379085 | 0 | 0 | 0 | 0.00437032566355747 | 0 | 0 | 0 | 0 | opioid receptor, kappa 1 [Source:MGI Symbol;Acc:MGI:97439] | Environmental Information Processing | Signaling molecules and interaction | ko04080//Neuroactive ligand-receptor interaction | K04214 | GO:0005634//nucleus;GO:0005829//cytosol;GO:0005886//plasma membrane;GO:0005887//integral component of plasma membrane;GO:0016020//membrane;GO:0016021//integral component of membrane;GO:0030285//integral component of synaptic vesicle membrane;GO:0030425//dendrite;GO:0043025//neuronal cell body;GO:0043204//perikaryon;GO:0043679//axon terminus;GO:0045202//synapse | GO:0004930//G-protein coupled receptor activity;GO:0004985//opioid receptor activity;GO:0033612//receptor serine/threonine kinase binding;GO:0038048//dynorphin receptor activity;GO:0042277//peptide binding;GO:0042923//neuropeptide binding | GO:0006955//immune response;GO:0007165//signal transduction;GO:0007186//G-protein coupled receptor signaling pathway;GO:0007200//phospholipase C-activating G-protein coupled receptor signaling pathway;GO:0007218//neuropeptide signaling pathway;GO:0007610//behavior;GO:0007626//locomotory behavior;GO:0009314//response to radiation;GO:0019233//sensory perception of pain;GO:0031635//adenylate cyclase-inhibiting opioid receptor signaling pathway;GO:0032868//response to insulin;GO:0033603//positive regulation of dopamine secretion;GO:0033685//negative regulation of luteinizing hormone secretion;GO:0038003//opioid receptor signaling pathway;GO:0040017//positive regulation of locomotion;GO:0042220//response to cocaine;GO:0042711//maternal behavior;GO:0042755//eating behavior;GO:0043278//response to morphine;GO:0043627//response to estrogen;GO:0044849//estrous cycle;GO:0045471//response to ethanol;GO:0046877//regulation of saliva secretion;GO:0048148//behavioral response to cocaine;GO:0050951//sensory perception of temperature stimulus;GO:0051607//defense response to virus;GO:0051930//regulation of sensory perception of pain;GO:0071222//cellular response to lipopolysaccharide;GO:0071333//cellular response to glucose stimulus;GO:1900745//positive regulation of p38MAPK cascade;GO:1901381//positive regulation of potassium ion transmembrane transport;GO:1903937//response to acrylamide;GO:1904000//positive regulation of eating behavior;GO:1990708//conditioned place preference |
| ENSMUSG00000033774 | Npbwr1 | 0 | 0 | 5.96938624143624e-04 | 0 | 0 | 0 | 0 | 0 | 0 | 0 | 0 | 0 | 0 | 0 | 0 | 0 | 0 | neuropeptides B/W receptor 1 [Source:MGI Symbol;Acc:MGI:891989] | Environmental Information Processing | Signaling molecules and interaction | ko04080//Neuroactive ligand-receptor interaction | K05268 | GO:0005886//plasma membrane;GO:0005887//integral component of plasma membrane;GO:0016020//membrane;GO:0016021//integral component of membrane | GO:0004930//G-protein coupled receptor activity;GO:0008188//neuropeptide receptor activity;GO:0042277//peptide binding;GO:0042923//neuropeptide binding | GO:0007165//signal transduction;GO:0007186//G-protein coupled receptor signaling pathway;GO:0007218//neuropeptide signaling pathway;GO:0019222//regulation of metabolic process |
| ENSMUSG00000025907 | Rb1cc1 | 3.30328376208563 | 3.04799348081474 | 3.45650744986552 | 3.05993932772195 | 3.09277547527167 | 3.44357076756973 | 3.1156314624952 | 3.28496131115826 | 3.41509298307832 | 3.36024611273427 | 3.01818124051953 | 2.82362023797078 | 2.6601941435894 | 3.43485253252928 | 3.05517869661045 | 3.59175937354102 | 2.86506491844575 | RB1-inducible coiled-coil 1 [Source:MGI Symbol;Acc:MGI:1341850] | Cellular Processes;Organismal Systems | Transport and catabolism;Aging | ko04140//Autophagy - animal;ko04211//Longevity regulating pathway - mammal | K17589;K17589 | GO:0000407//pre-autophagosomal structure;GO:0005634//nucleus;GO:0005737//cytoplasm;GO:0005764//lysosome;GO:0005829//cytosol;GO:0019898//extrinsic component of membrane;GO:0031965//nuclear membrane;GO:0034045//pre-autophagosomal structure membrane;GO:1990316//ATG1/ULK1 kinase complex | GO:0005515//protein binding;GO:0019901//protein kinase binding | GO:0000045//autophagosome assembly;GO:0000422//mitophagy;GO:0001889//liver development;GO:0001934//positive regulation of protein phosphorylation;GO:0006914//autophagy;GO:0007049//cell cycle;GO:0007507//heart development;GO:0030242//pexophagy;GO:0034727//piecemeal microautophagy of nucleus;GO:0043066//negative regulation of apoptotic process;GO:0045793//positive regulation of cell size;GO:0046330//positive regulation of JNK cascade;GO:0061709//reticulophagy;GO:0061723//glycophagy;GO:2001237//negative regulation of extrinsic apoptotic signaling pathway |
| ENSMUSG00000090031 | 4732440D04Rik | 0.122877423529032 | 0.0703952248560768 | 0.156317799960577 | 0.0832192207319909 | 0.119680065817666 | 0.118271462598377 | 0.0797744994999933 | 0.0923538580582054 | 0.129121223419939 | 0.136000974114012 | 0.113796621835062 | 0.0765997522745303 | 0.0979933295747586 | 0.122474666133786 | 0.0441531492216893 | 0.188173830531967 | 0.0618884646090815 | RIKEN cDNA 4732440D04 gene [Source:MGI Symbol;Acc:MGI:3604103] | - | - | - | - | - | - | - |
| ENSMUSG00000087247 | Alkal1 | 0.00345489960970629 | 7.0440844870311e-04 | 0.00111772618726273 | 0 | 5.87705840297403e-04 | 0 | 0.0047789520586033 | 0.00117245926026497 | 0.0127682242038211 | 0.00791448853668372 | 0.00281087426059953 | 0.00456262661288851 | 0.00634068768562363 | 0 | 0 | 0 | 0 | ALK and LTK ligand 1 [Source:MGI Symbol;Acc:MGI:3645495] | - | - | - | - | GO:0005575//cellular_component;GO:0005576//extracellular region | GO:0030298//receptor signaling protein tyrosine kinase activator activity;GO:0030971//receptor tyrosine kinase binding | GO:0010976//positive regulation of neuron projection development;GO:0061098//positive regulation of protein tyrosine kinase activity;GO:0070374//positive regulation of ERK1 and ERK2 cascade;GO:0070378//positive regulation of ERK5 cascade |
细胞与亚群对照表:2.Cluster/2.cluster/Cells.cluster.list.xls
| Cells | Cluster | Samples |
|---|---|---|
| Control_AAACCCAAGAAGTATC | 3 | Control |
| Control_AAACCCAAGAGGGCGA | 1 | Control |
| Control_AAACCCAAGCCATTGT | 3 | Control |
| Control_AAACCCAAGTGCTCAT | 4 | Control |
| Control_AAACCCACACATTACG | 0 | Control |
| Control_AAACCCACACTCACTC | 3 | Control |
| Control_AAACCCAGTATAGCTC | 11 | Control |
| Control_AAACCCAGTCATGACT | 10 | Control |
| Control_AAACCCAGTCCGGCAT | 3 | Control |
| Control_AAACCCAGTCTACTGA | 4 | Control |
| Control_AAACCCAGTGGTTCTA | 1 | Control |
| Control_AAACCCAGTGTCCTAA | 6 | Control |
| Control_AAACCCATCACCACAA | 0 | Control |
| Control_AAACCCATCCTCTCGA | 3 | Control |
| Control_AAACCCATCGAAATCC | 4 | Control |
| Control_AAACGAAAGATTGAGT | 0 | Control |
| Control_AAACGAAAGGCTAACG | 4 | Control |
| Control_AAACGAACACCTATCC | 1 | Control |
| Control_AAACGAACATGAAGGC | 6 | Control |
| Control_AAACGAACATGTAACC | 3 | Control |
4.3 分类结果可视化
基于细胞亚群分类的结果,进一步利用tSNE(tSNE,t-Distributed Stochastic Neighbor Embedding)非线性聚类的方法对单细胞亚群分类结果进行可视化[4]。tSNE 的方法通常对不同亚群细胞的分类结果有更佳的呈现效果(亚群间的隔离更加清晰)。
对所有样本的亚群分类可视化,结果如下:
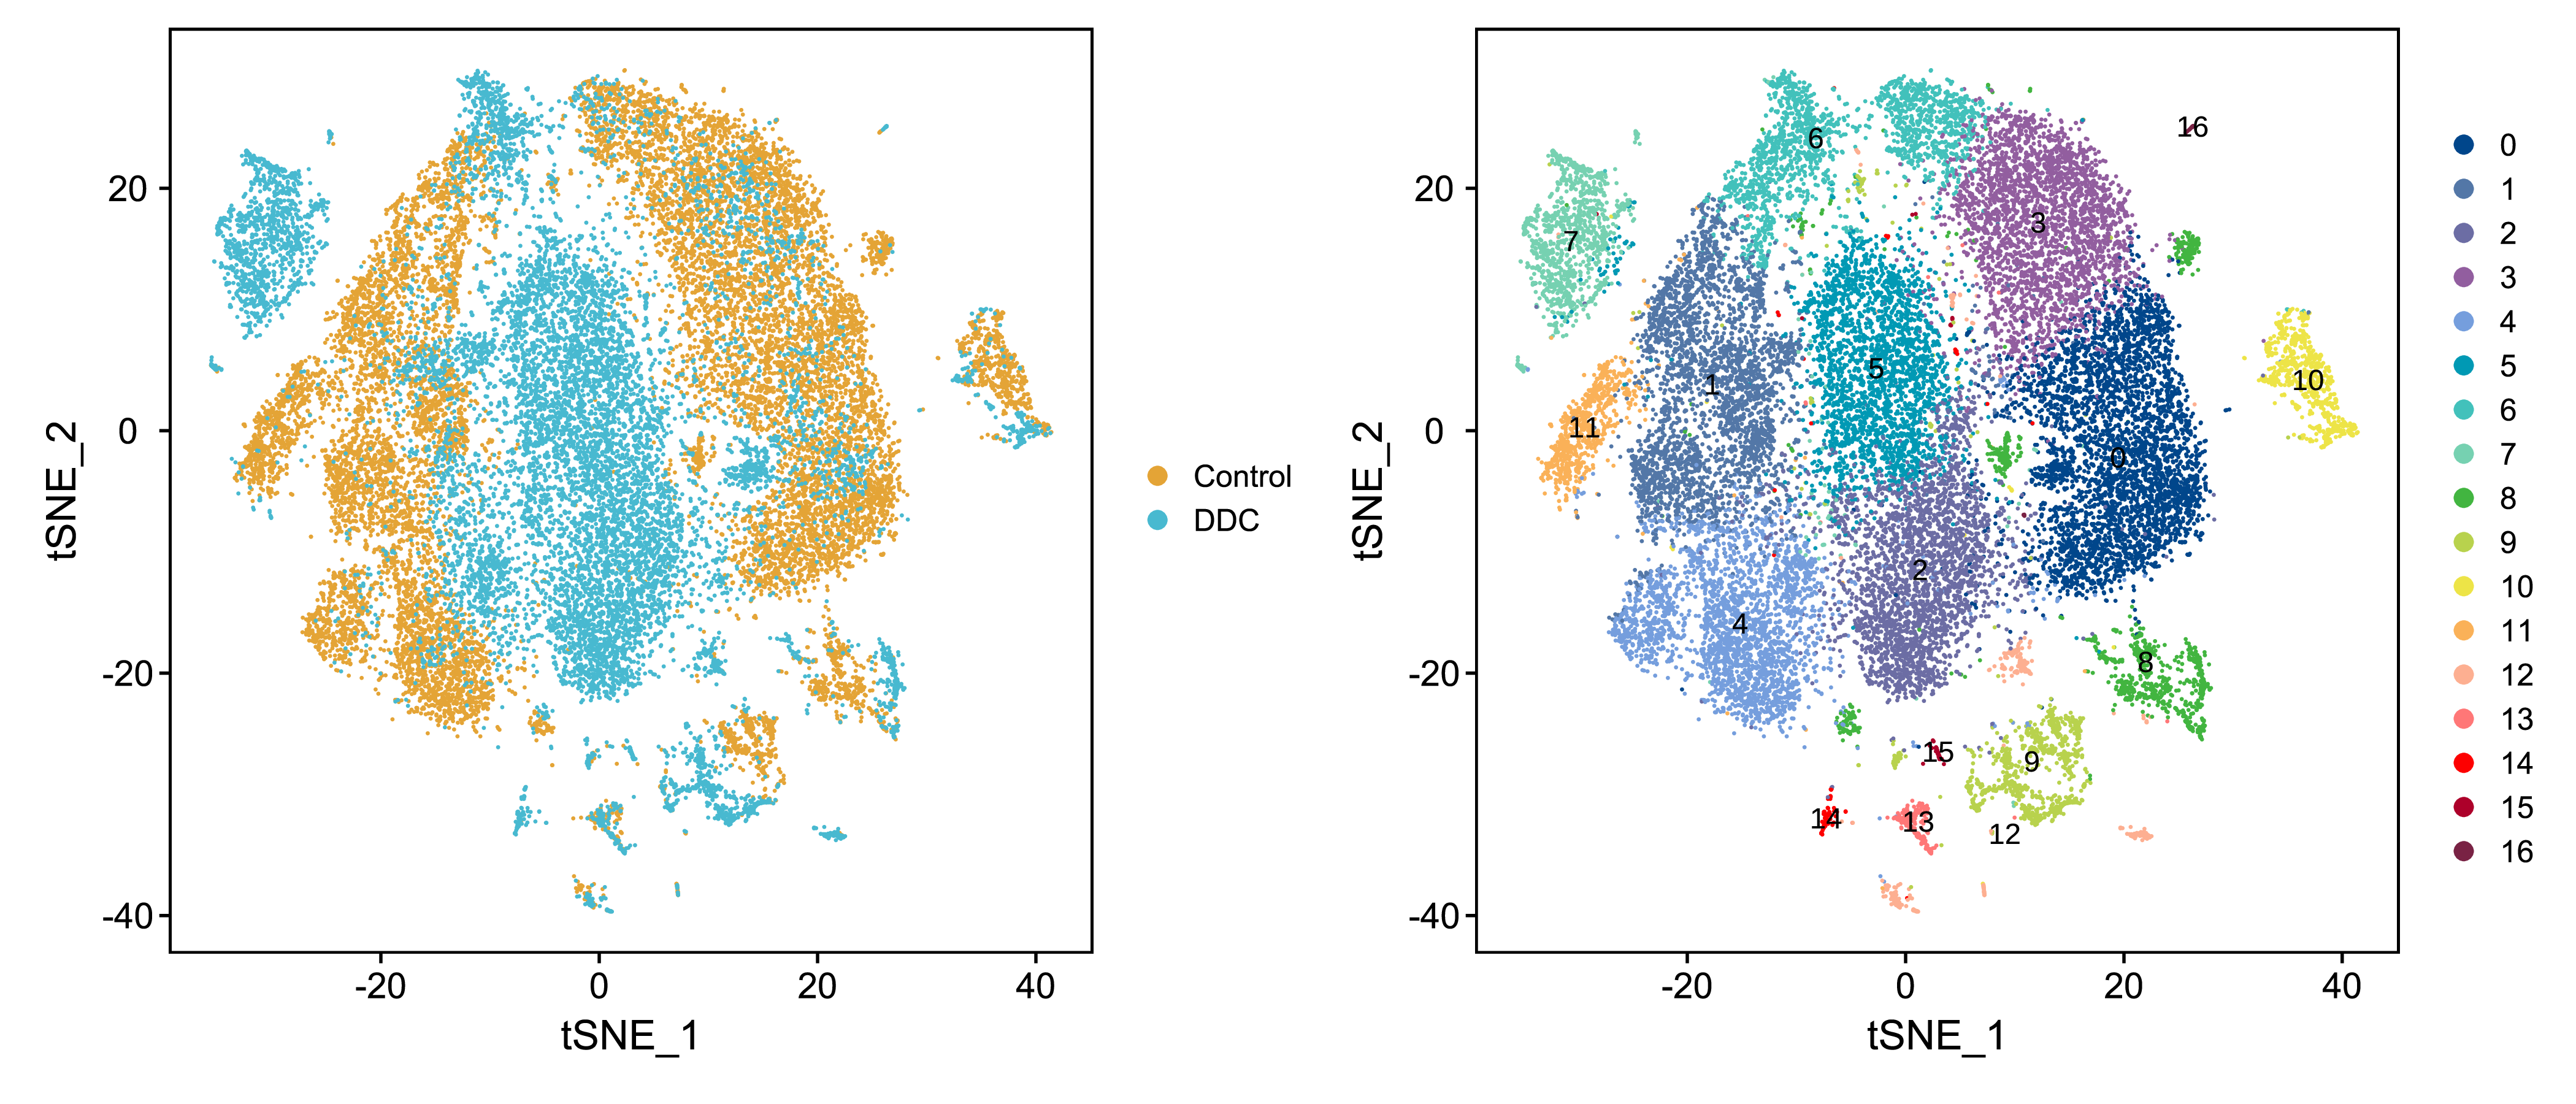 |
| Fig 4-3-1 单细胞亚群分类tSNE图 |
分别对各个样本的亚群分类可视化,结果如下:
- 样本Control单细胞亚群分类tSNE图
- 样本DDC单细胞亚群分类tSNE图
Fig 4-3-2 各样本单细胞亚群分类tSNE图
4.4 基于已知标记基因的分类效果评估
如果客户提前提供已知的在特定类型细胞表达的标记基因,那么我们可以分析标记基因在各个细胞亚群中的表达分布,从而:1)判断识别出的细胞亚群属于哪一类细胞;2)细胞亚群分类结果是否合理。
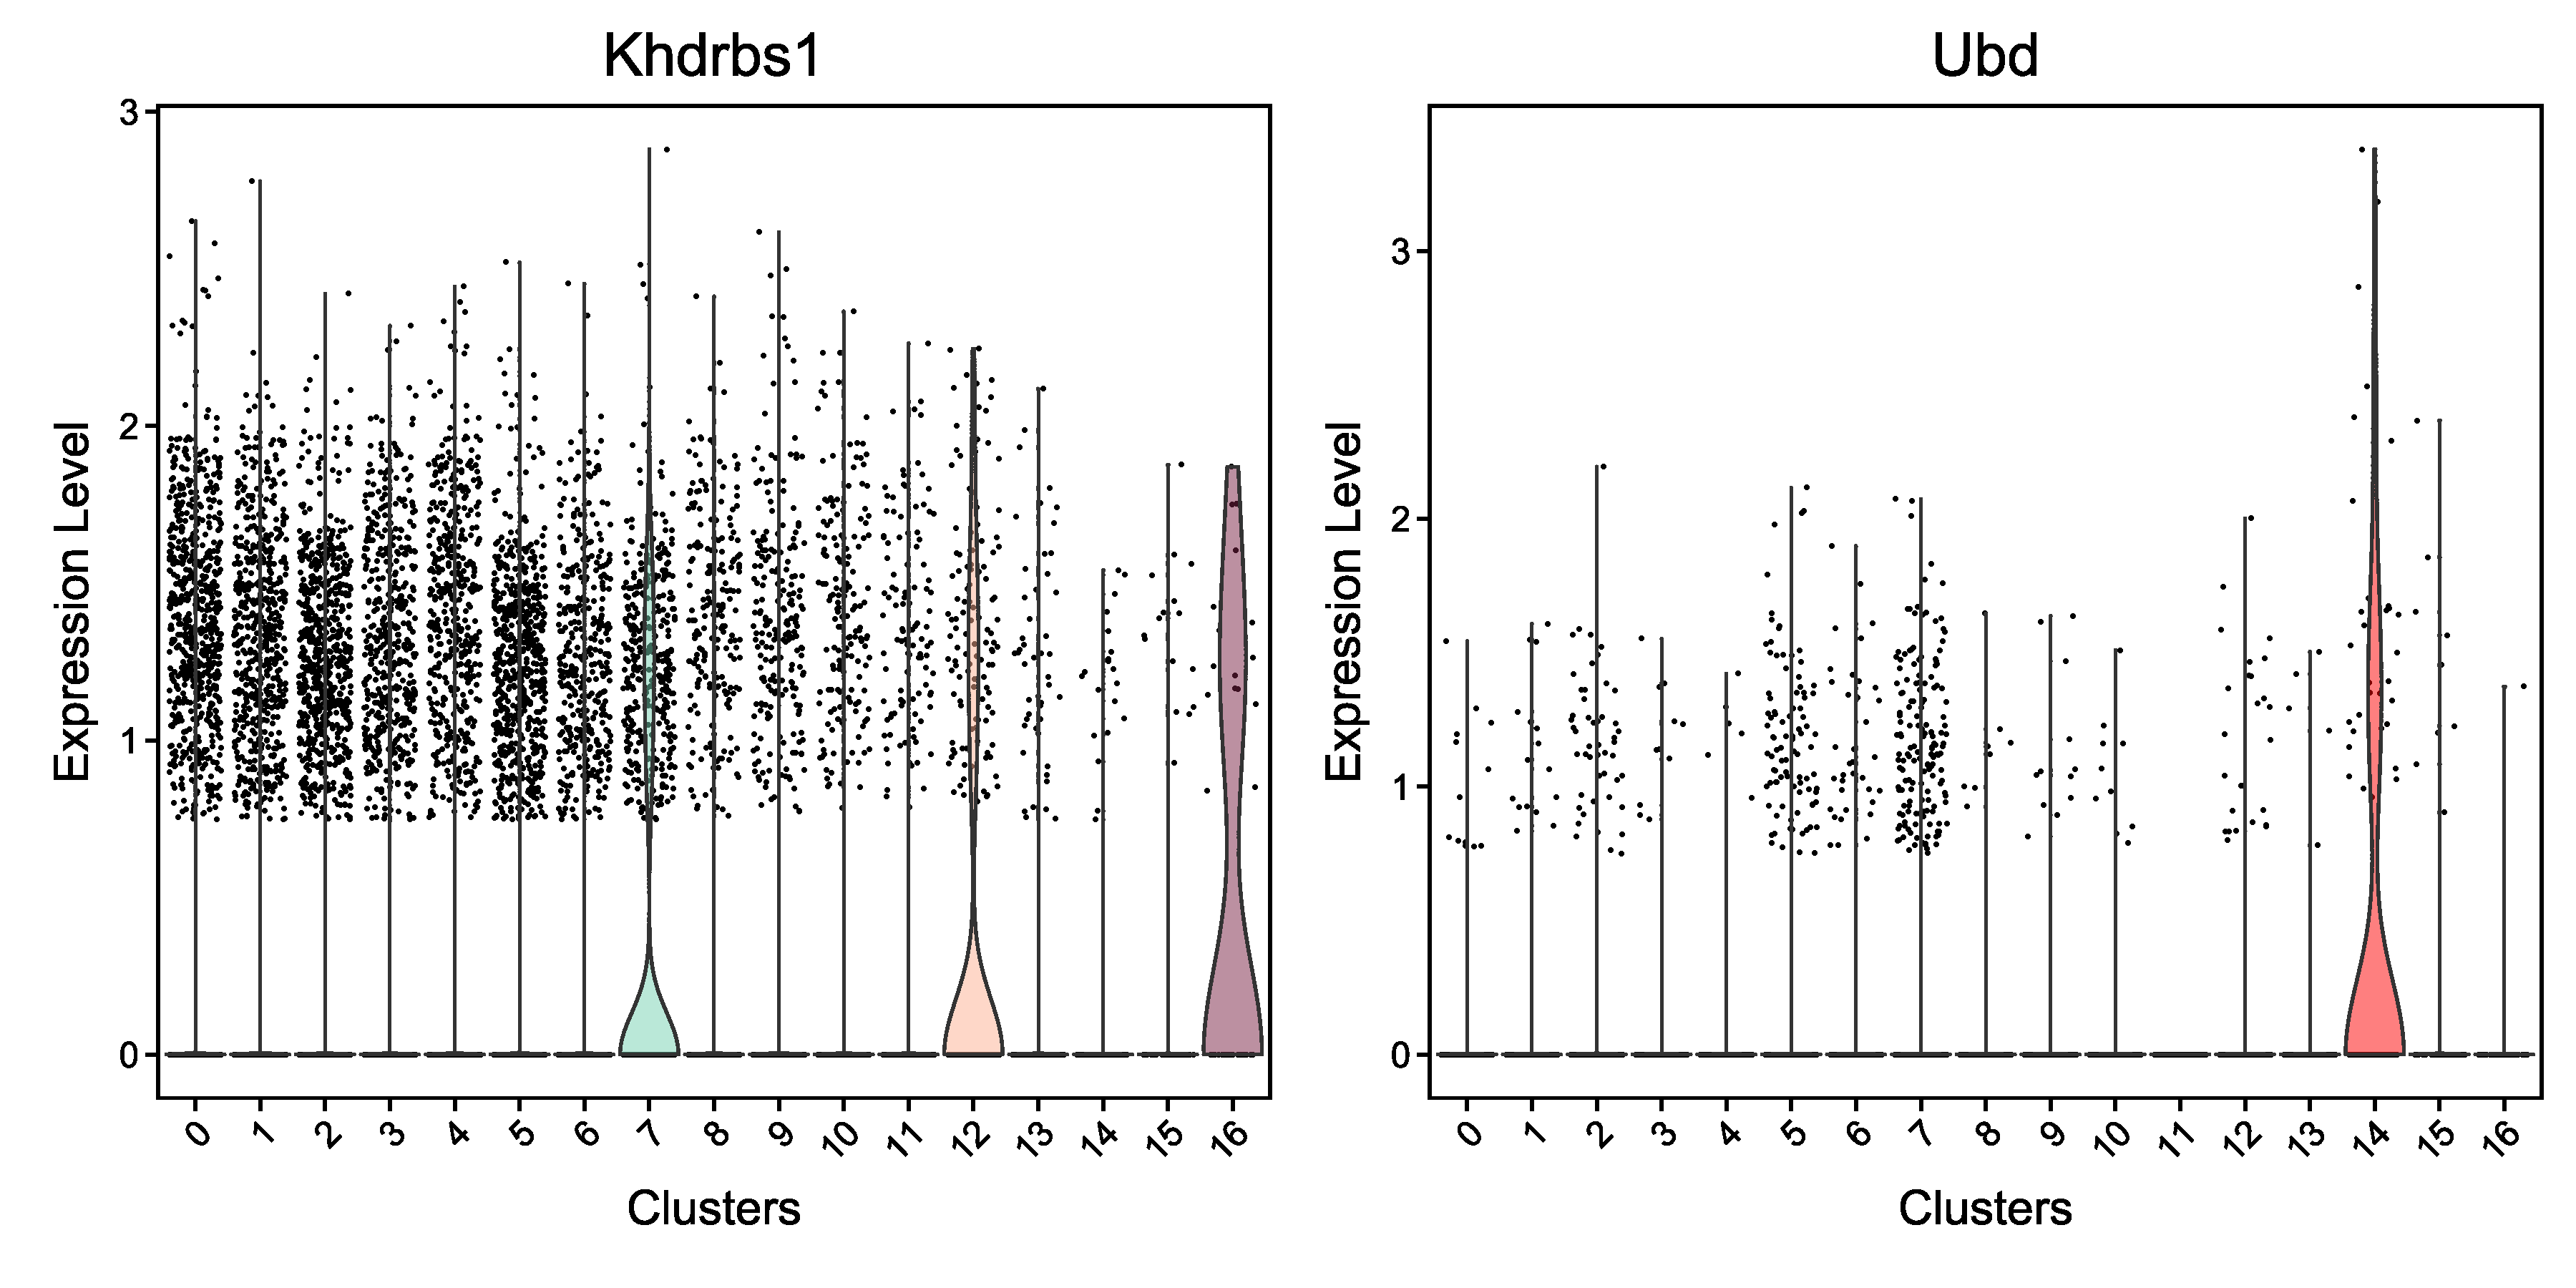 |
| Fig 4-4-1 已知标记基因在各个细胞亚群中的表达分布小提琴图 |
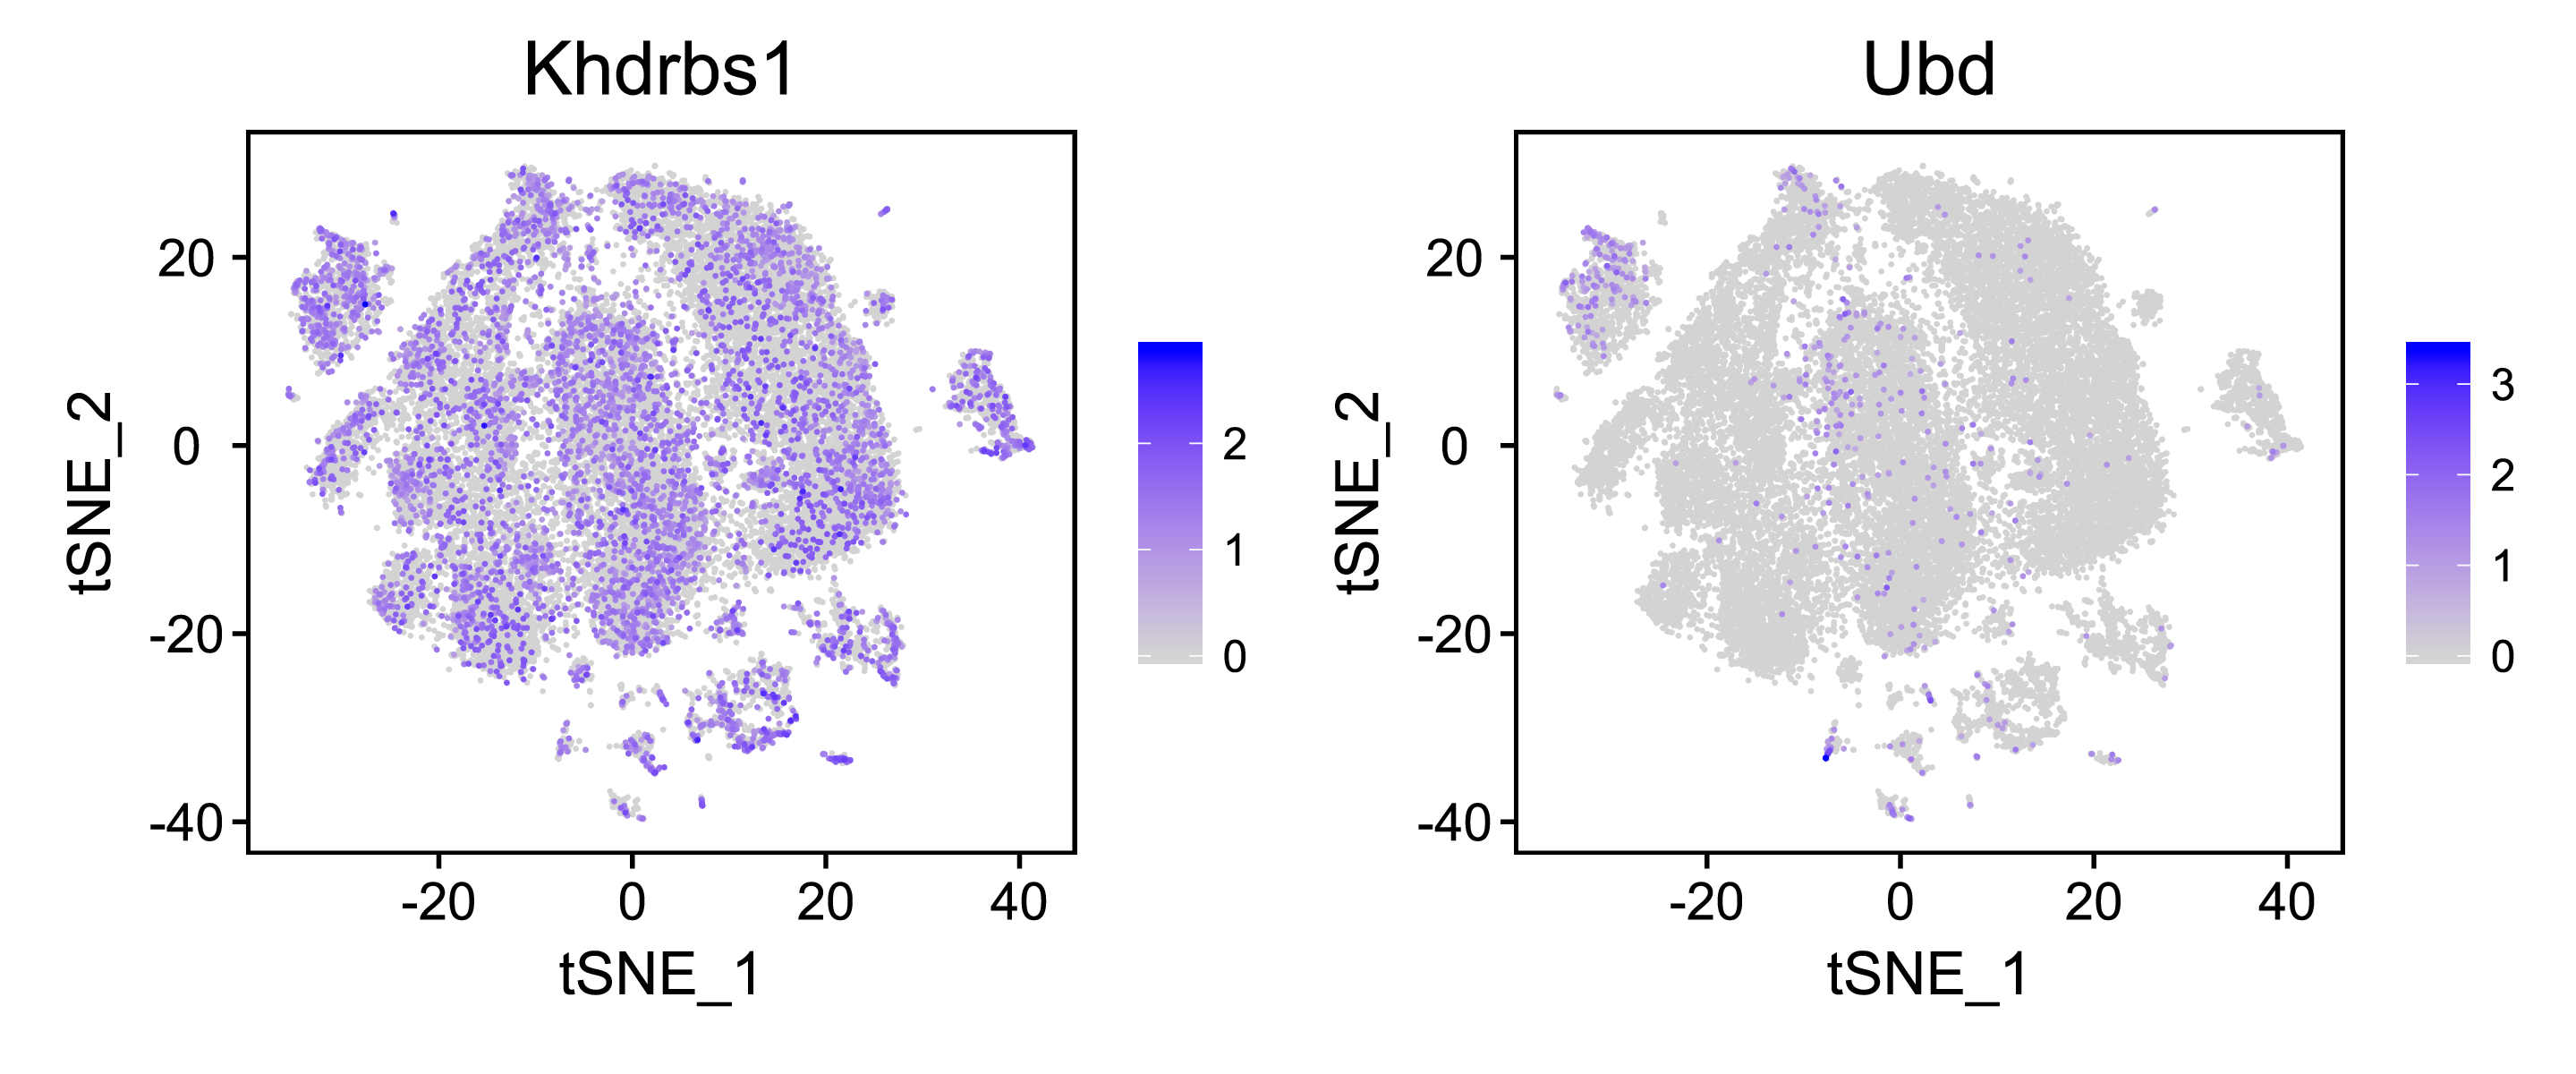 |
| Fig 4-4-2 已知标记基因在各个细胞亚群中的表达分布 |
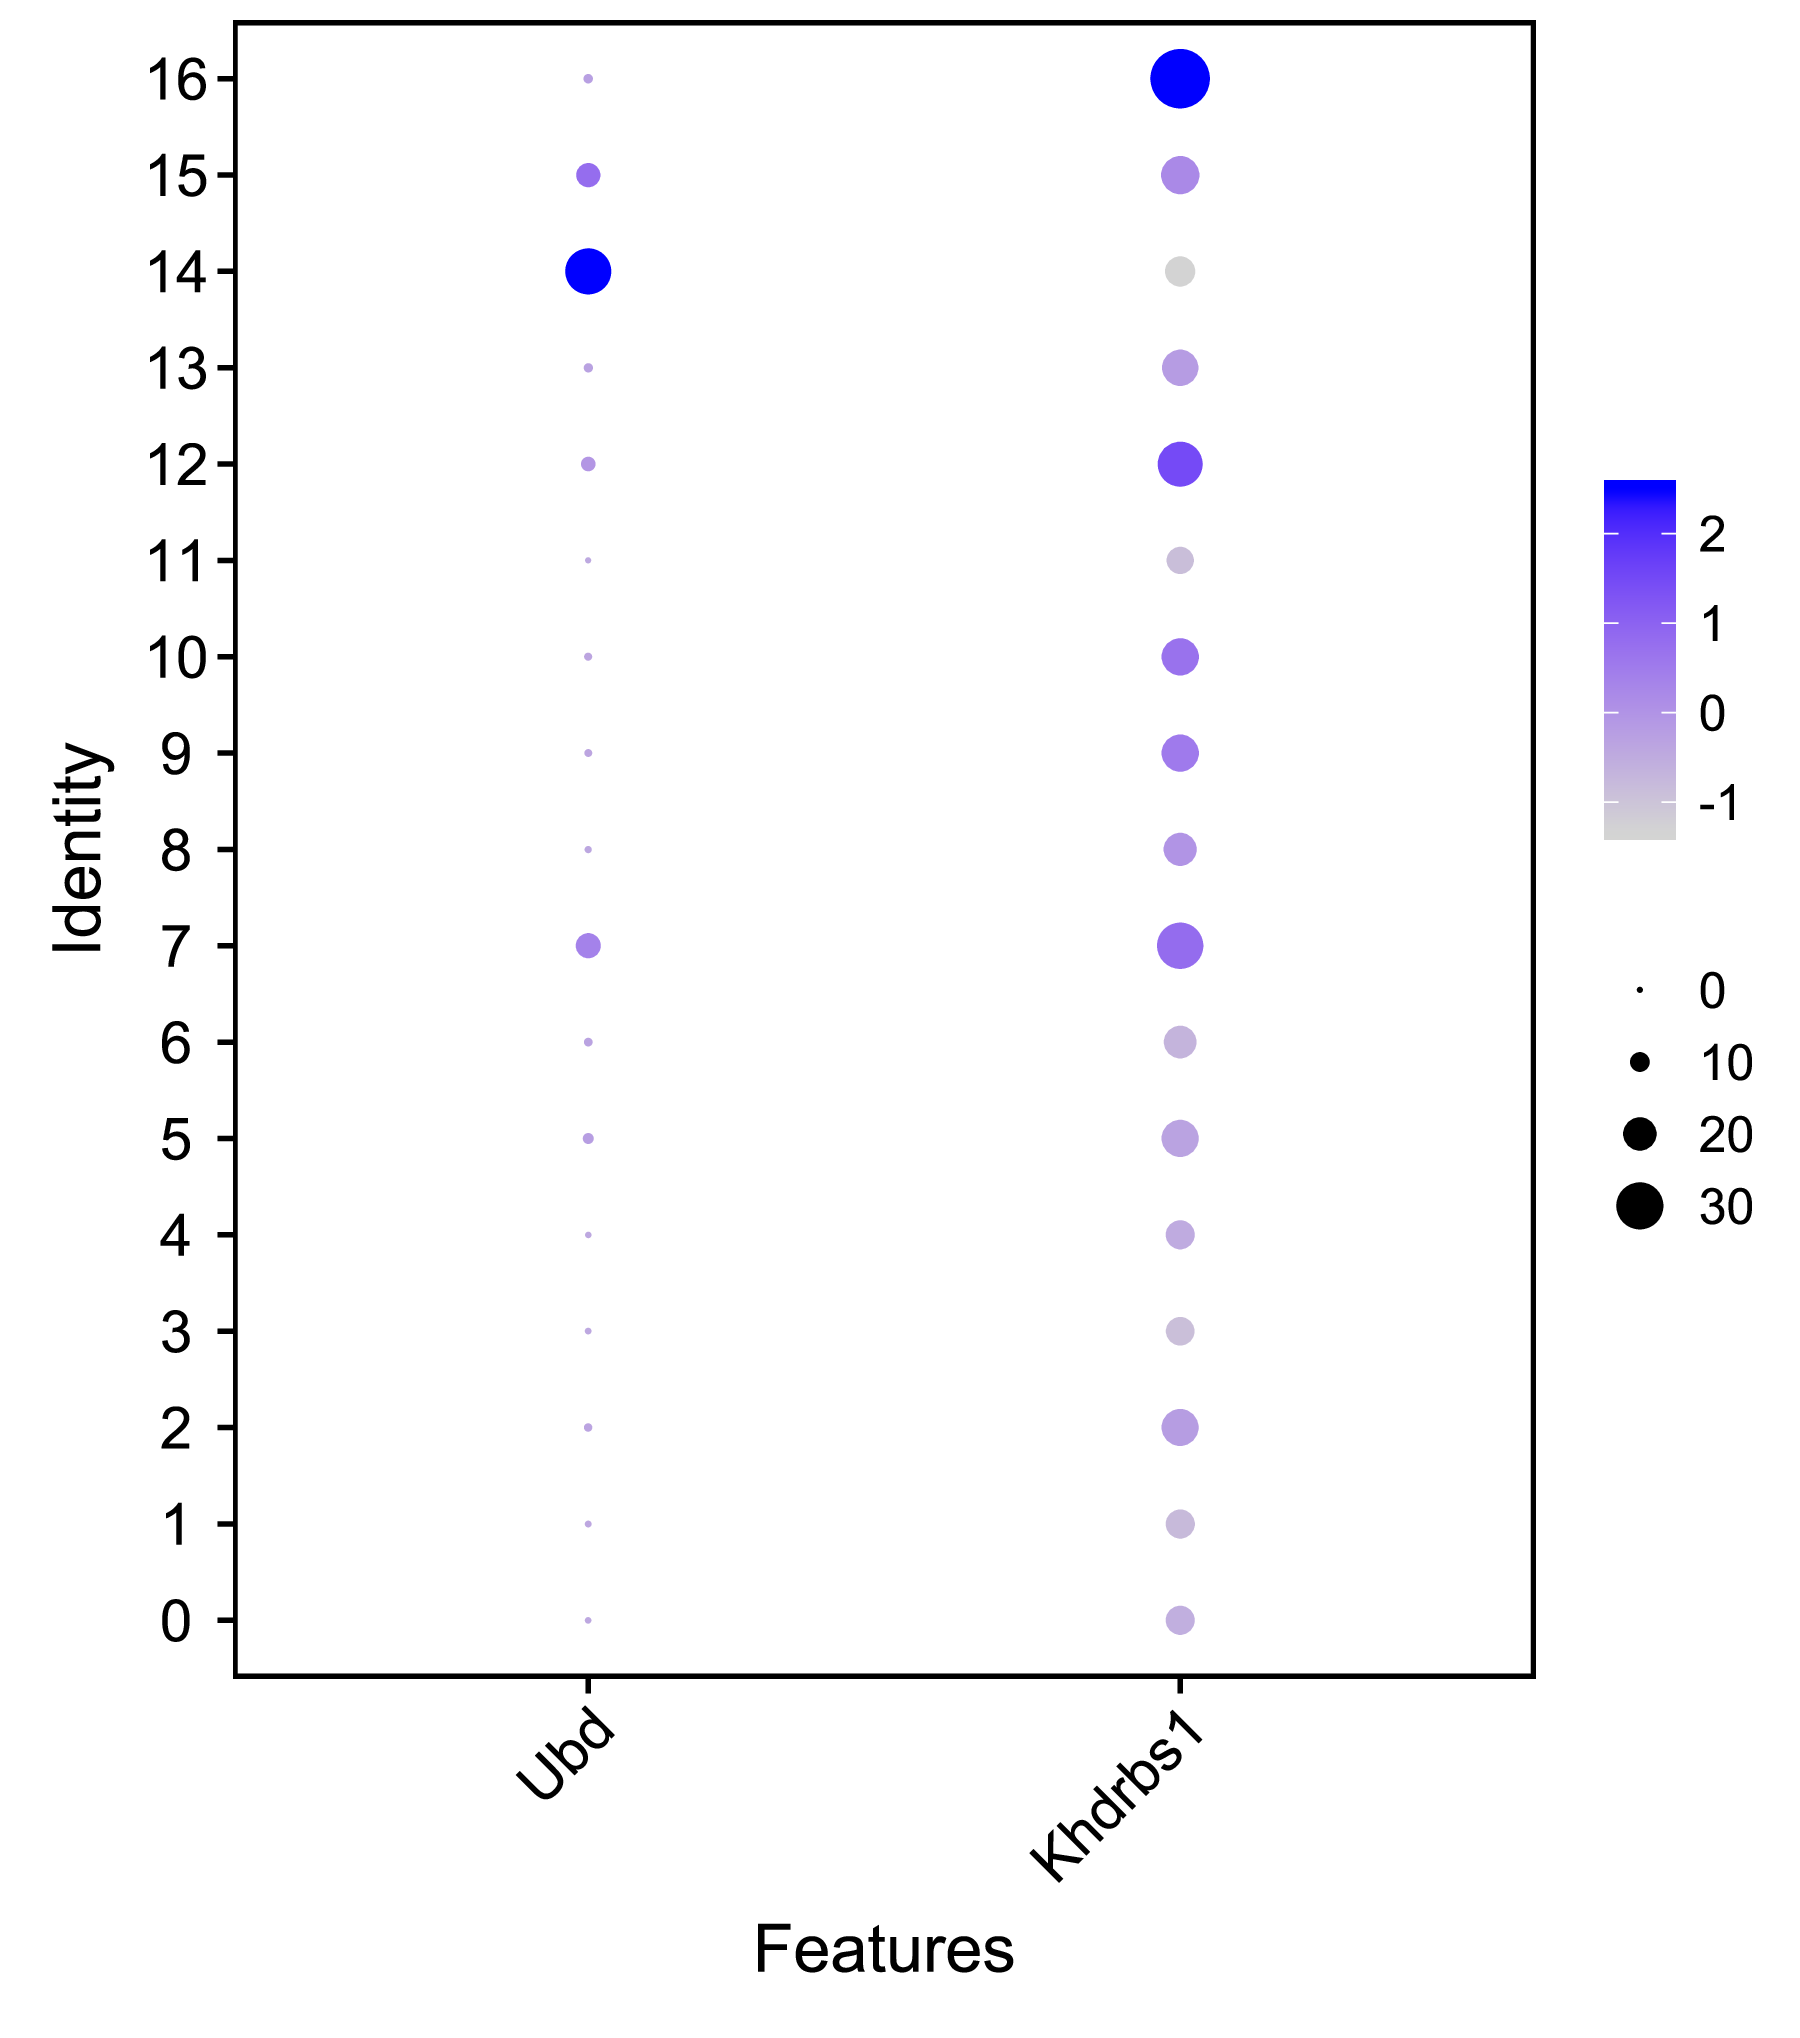 |
| Fig 4-4-3 已知标记基因在各个细胞亚群中的表达分布气泡图 |
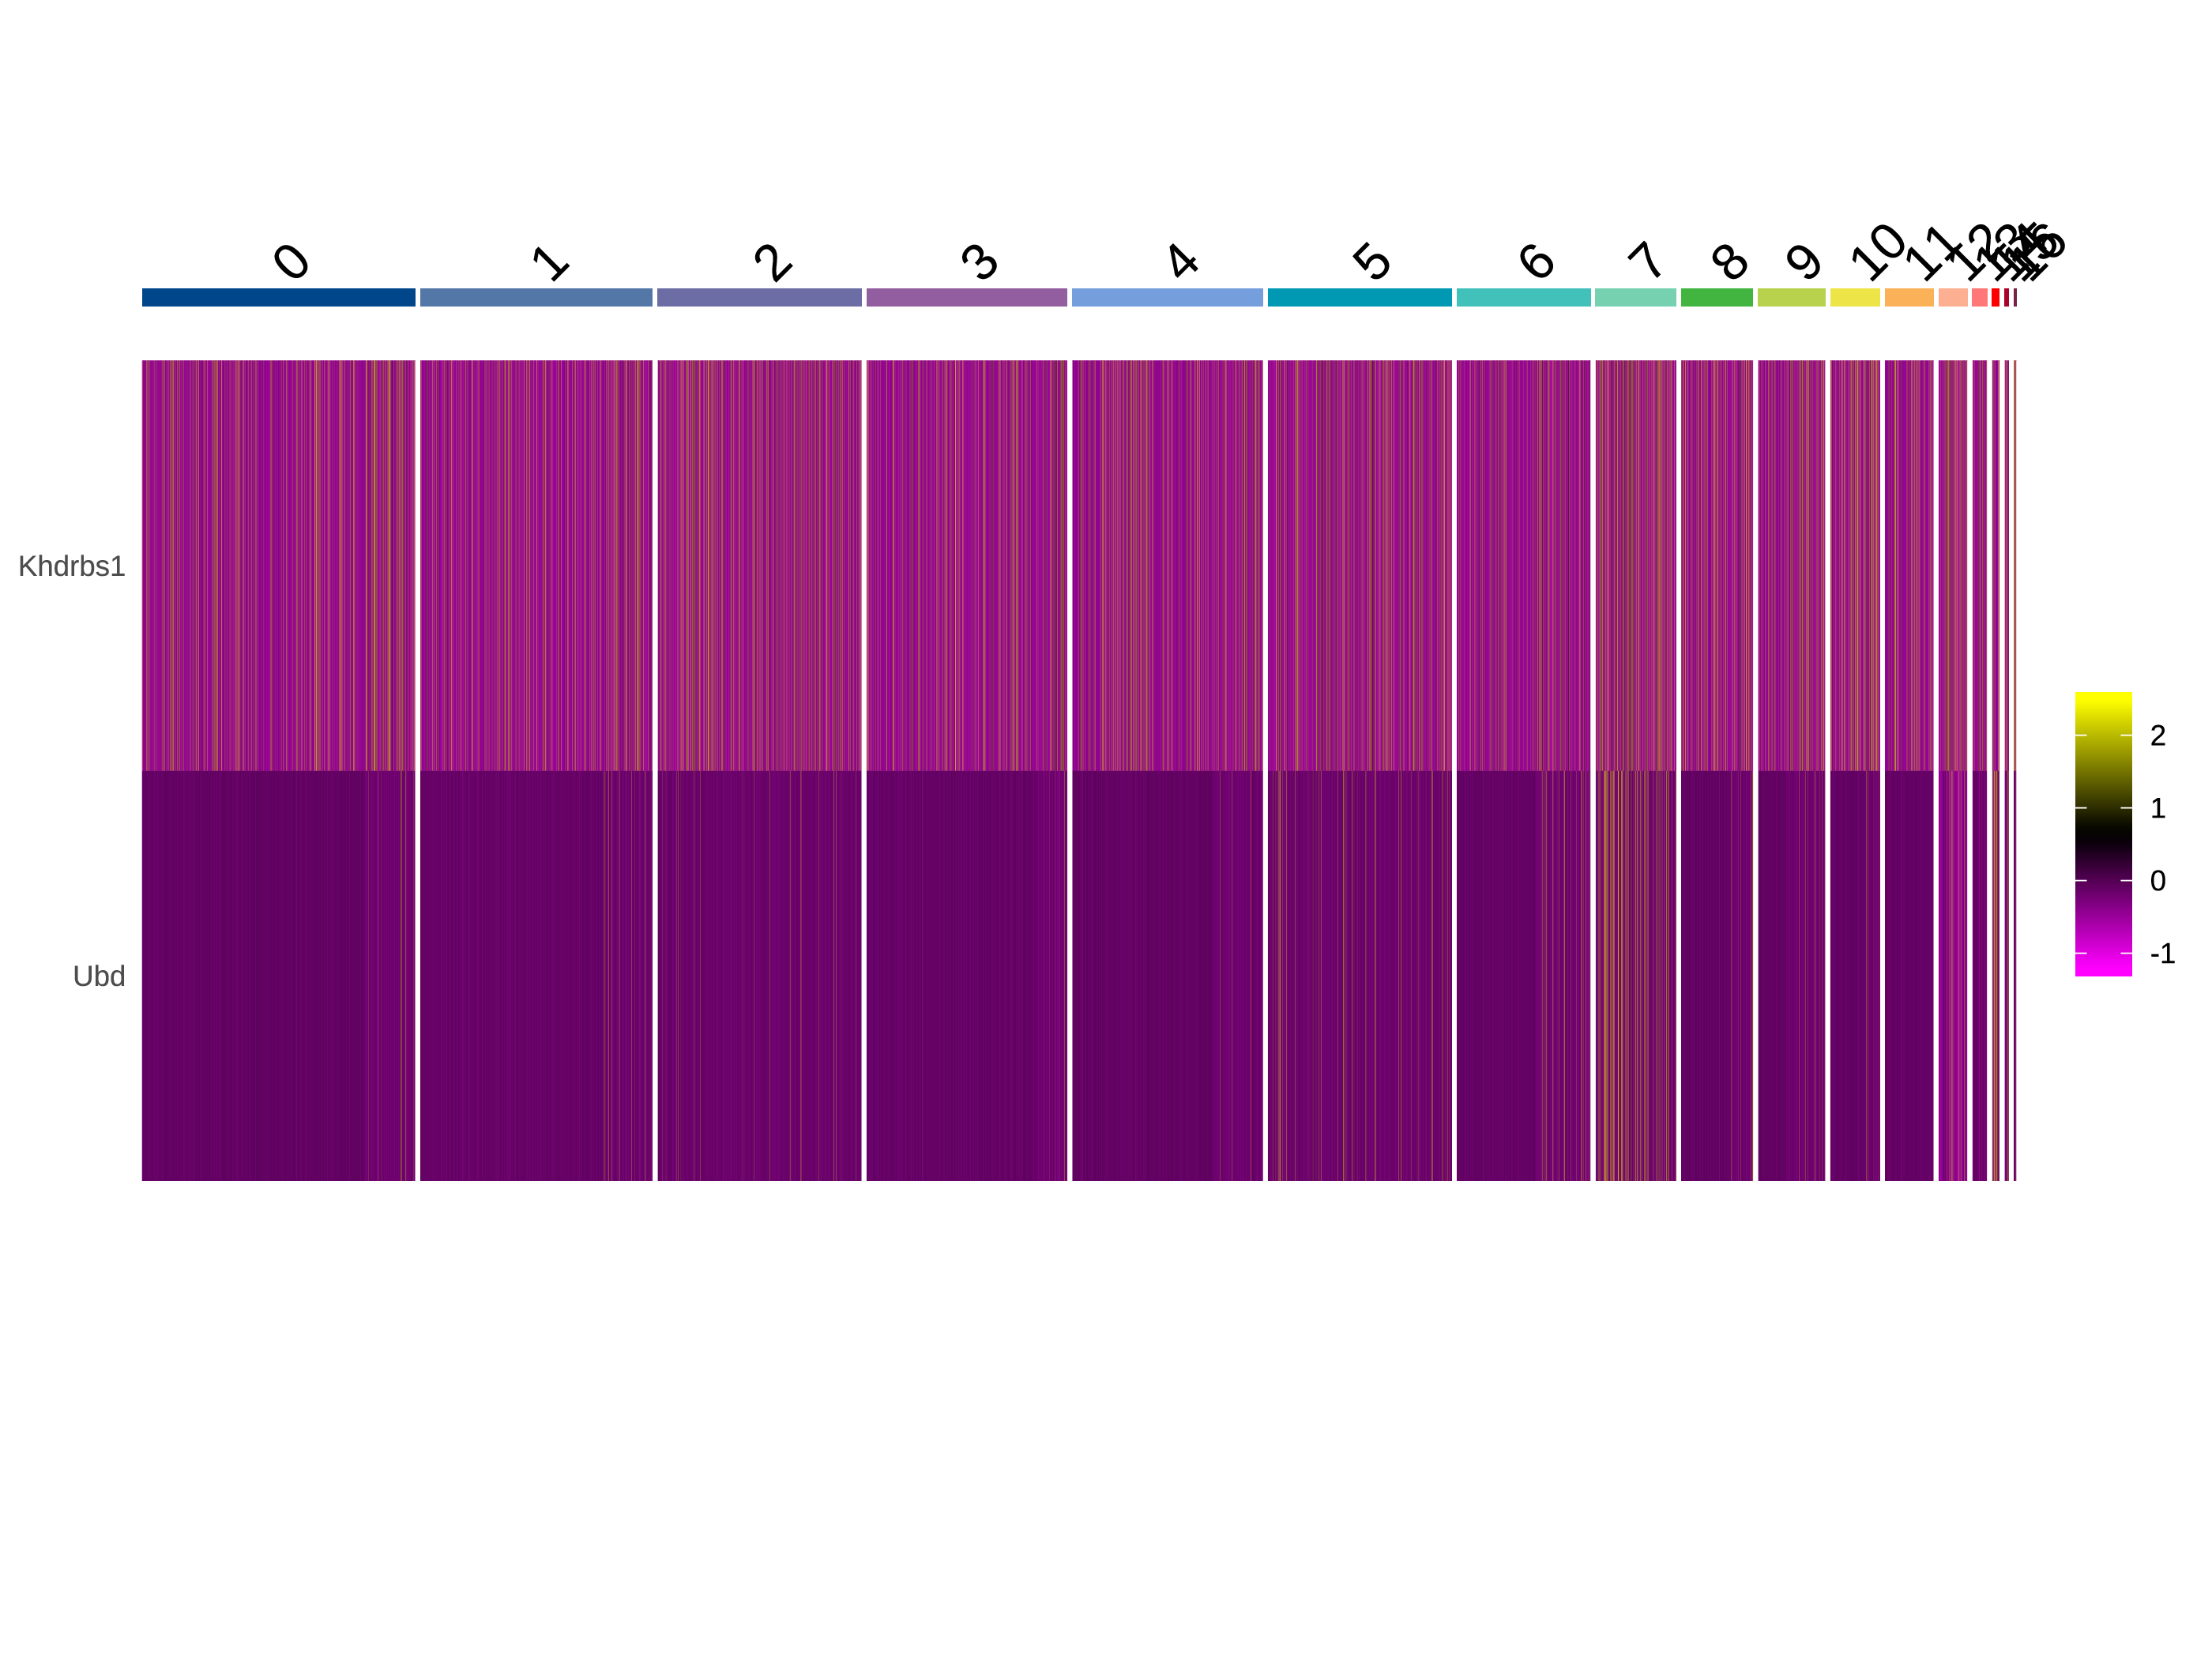 |
| Fig 4-4-4 已知标记基因在各个亚群的表达量热图 |
4.5 单细胞亚群鉴定
以上单细胞亚群分类是基于细胞表达特征的相似性进行聚类的,每个亚群不具有生物学意义。所以,细胞鉴定一直是很重要但又比较繁琐的步骤。这里,我们使用singleR[5]对所有细胞进行自动化注释,为后续的人工细胞鉴定工作提供参考。
singleR是通过细胞与参考数据库中细胞类型的相似度来自动化鉴定细胞类型,对于相似度较高的细胞类型的注释准确性会降低。所以,singleR的注释结果只能作为辅助手段,最终的细胞亚群鉴定结果依然需要人工鉴定的确认。
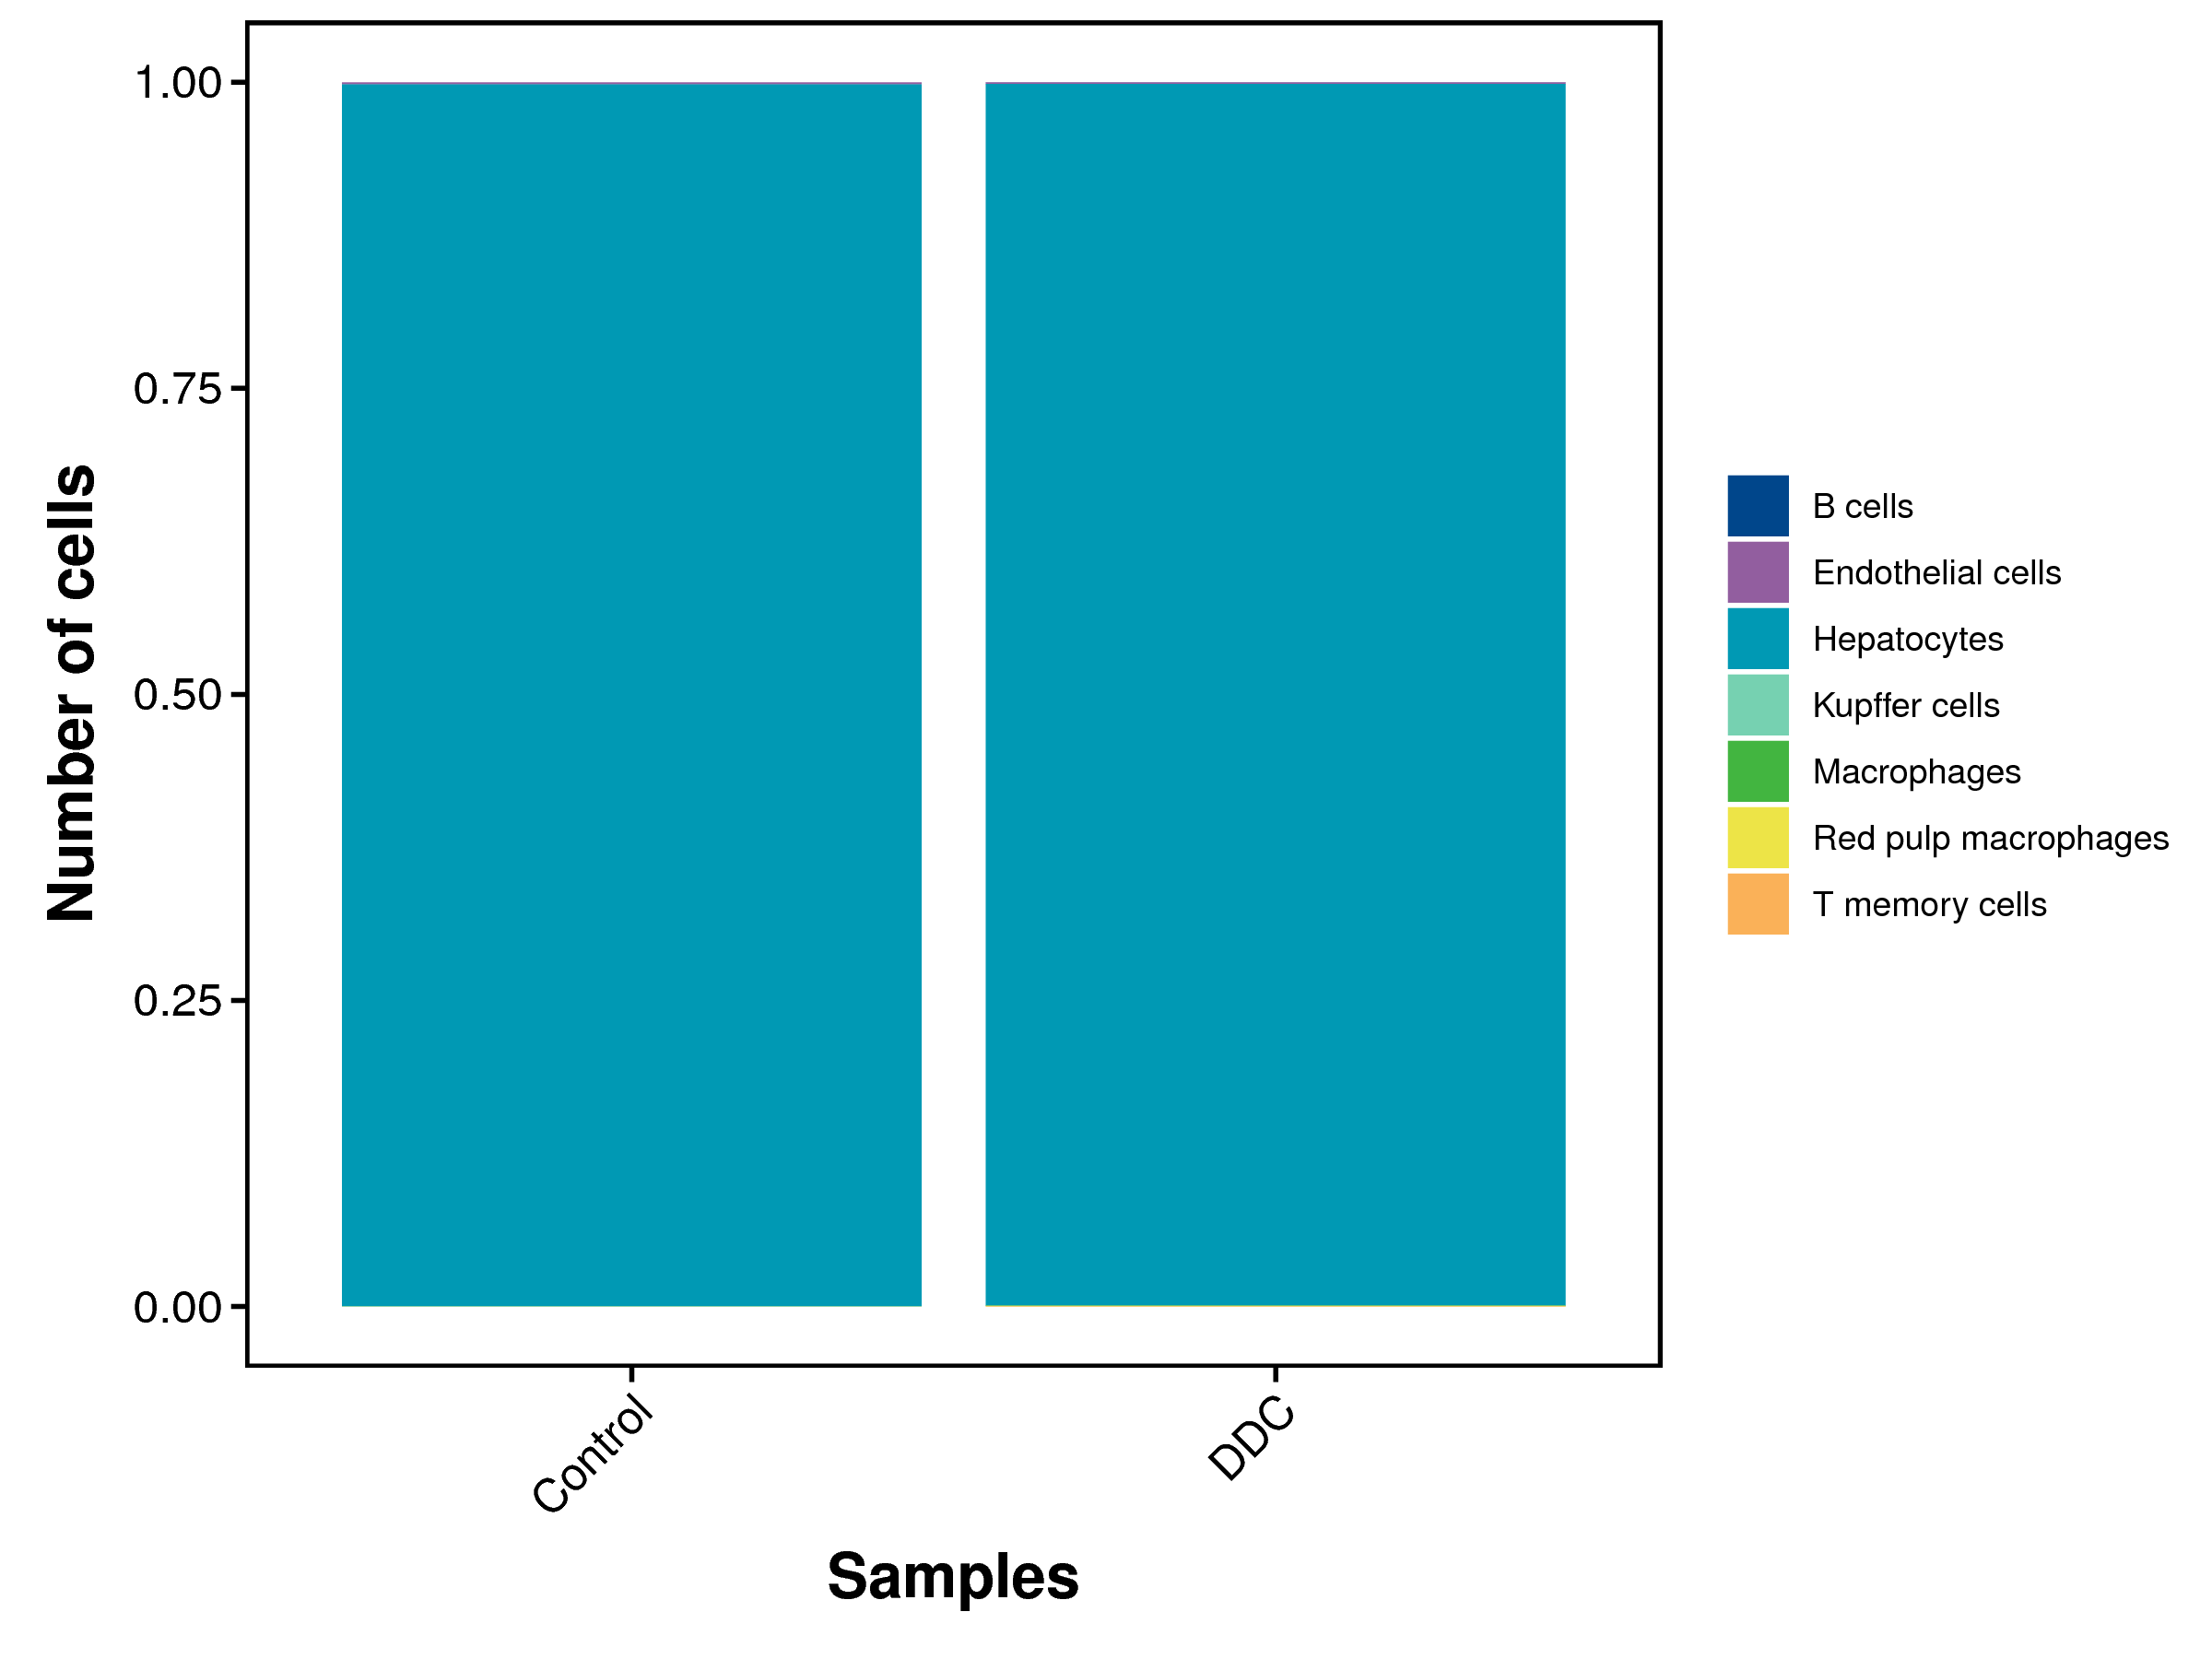
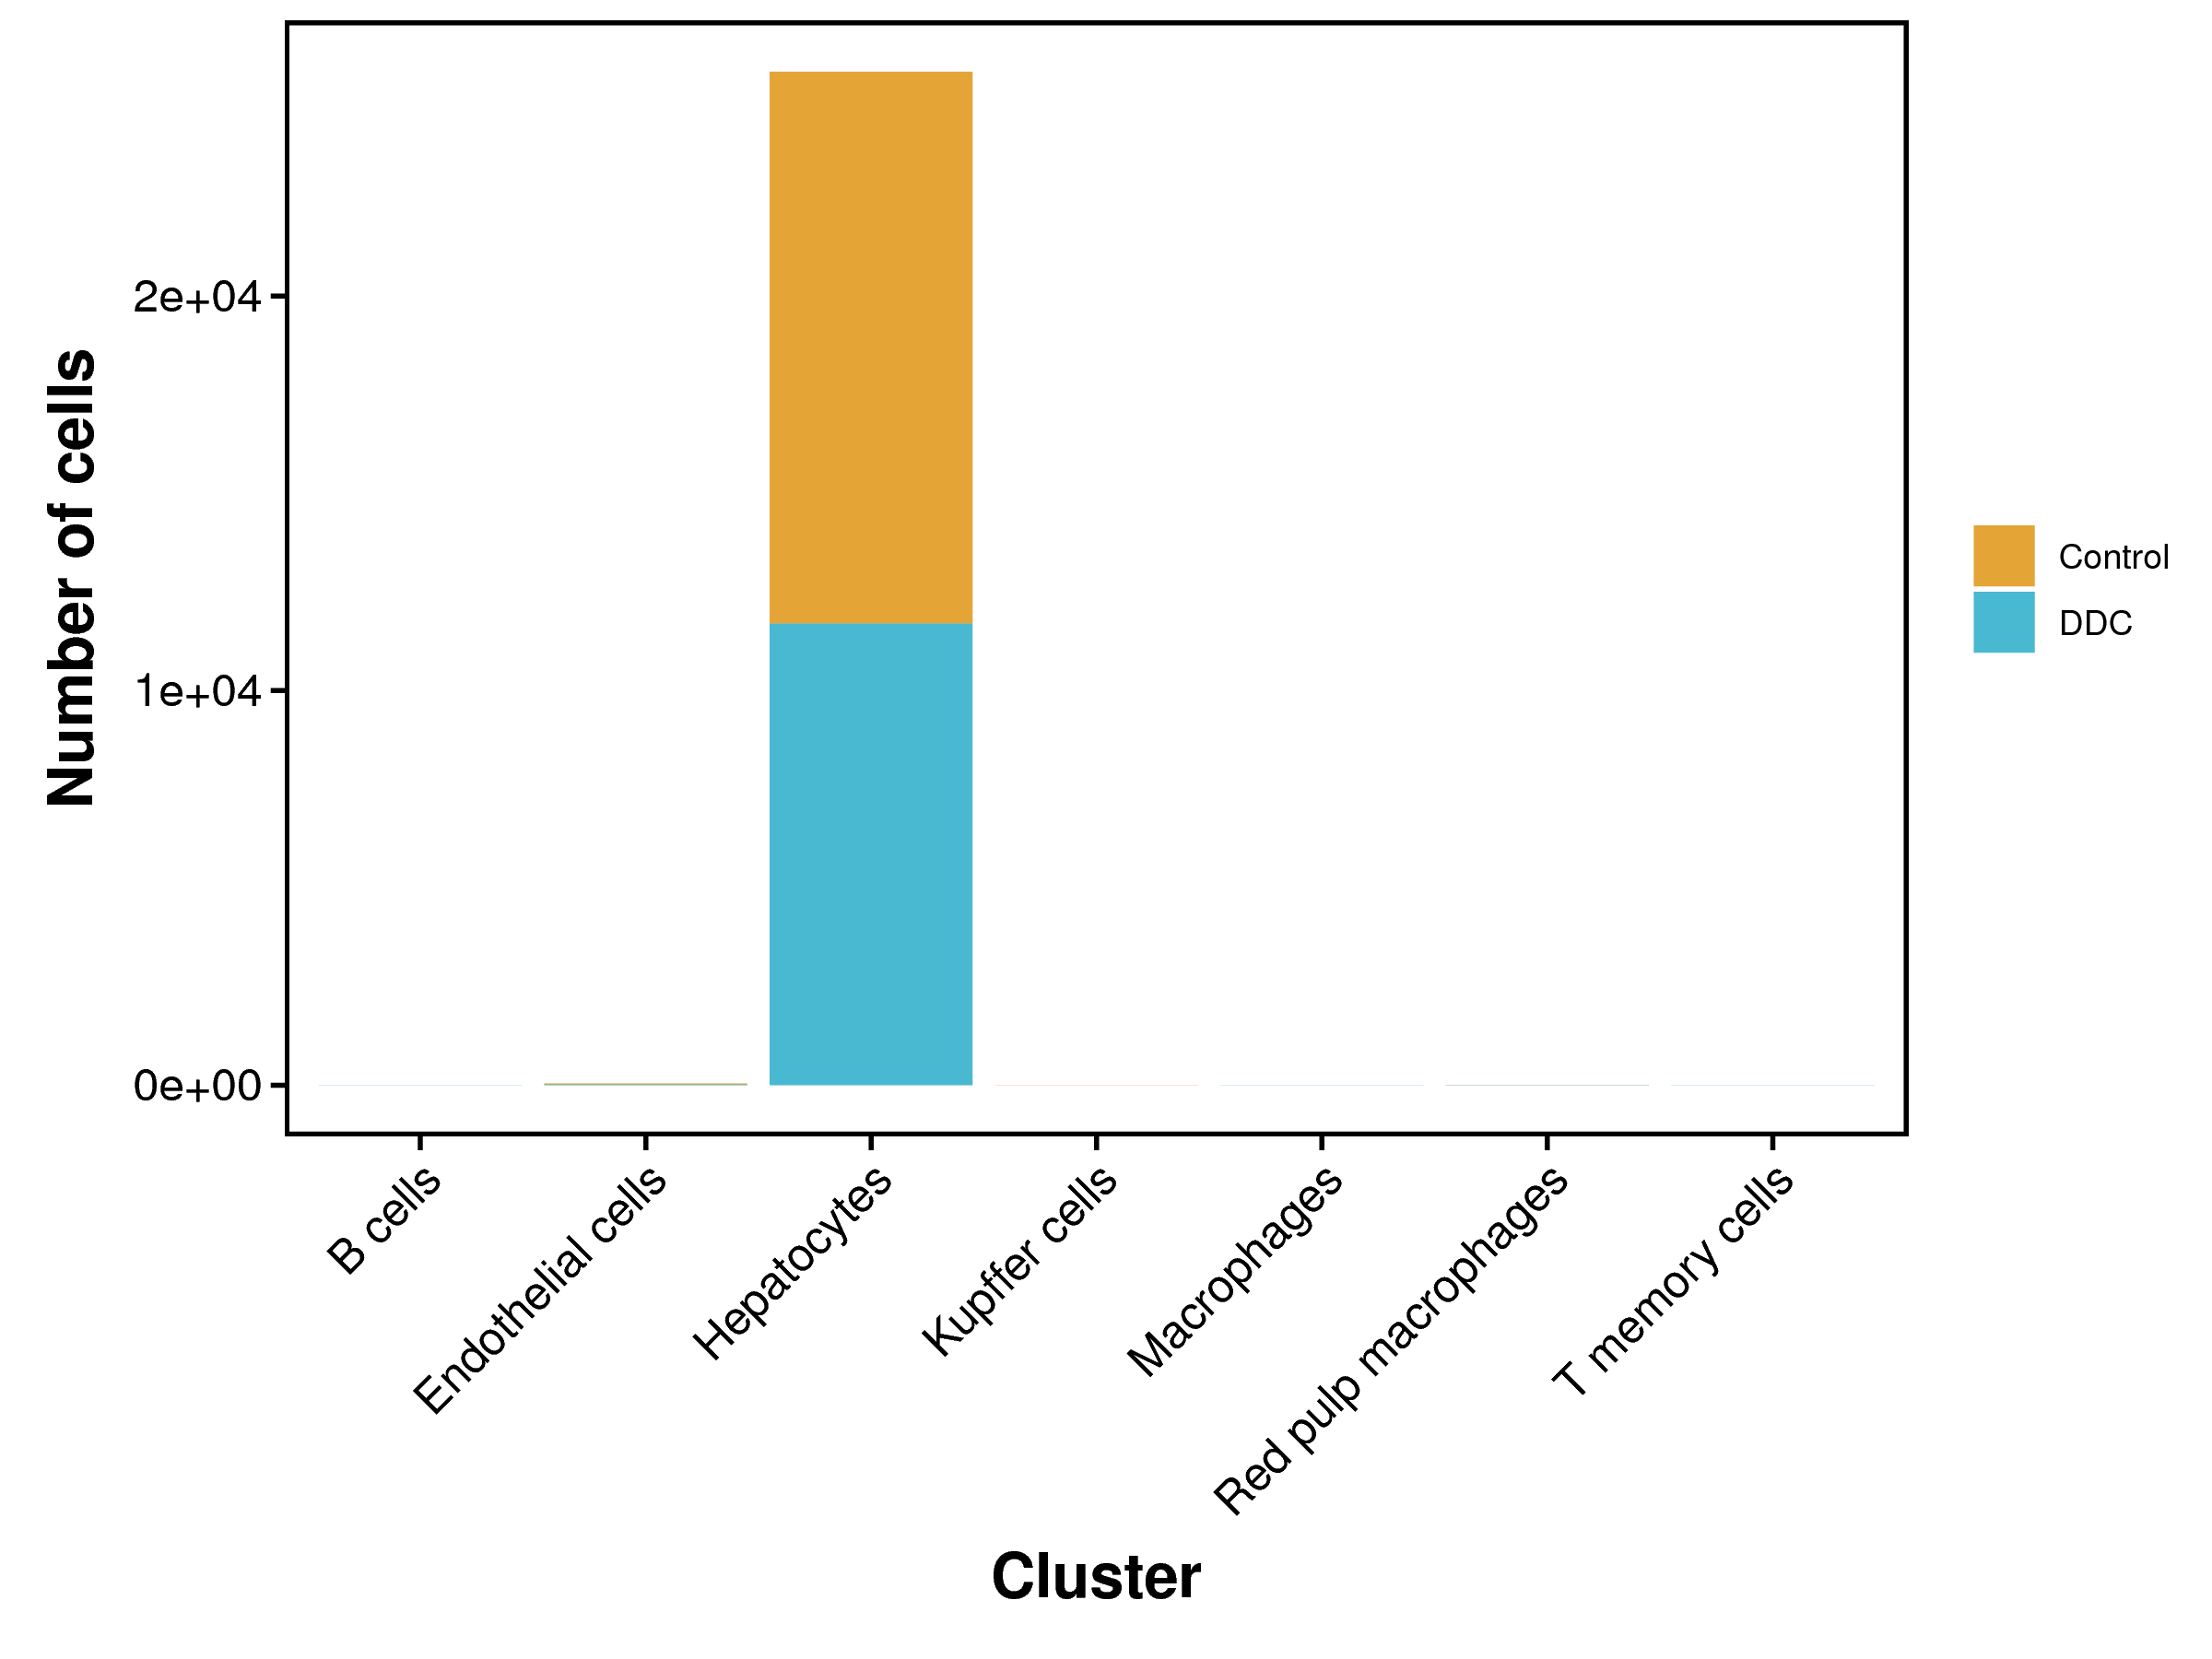
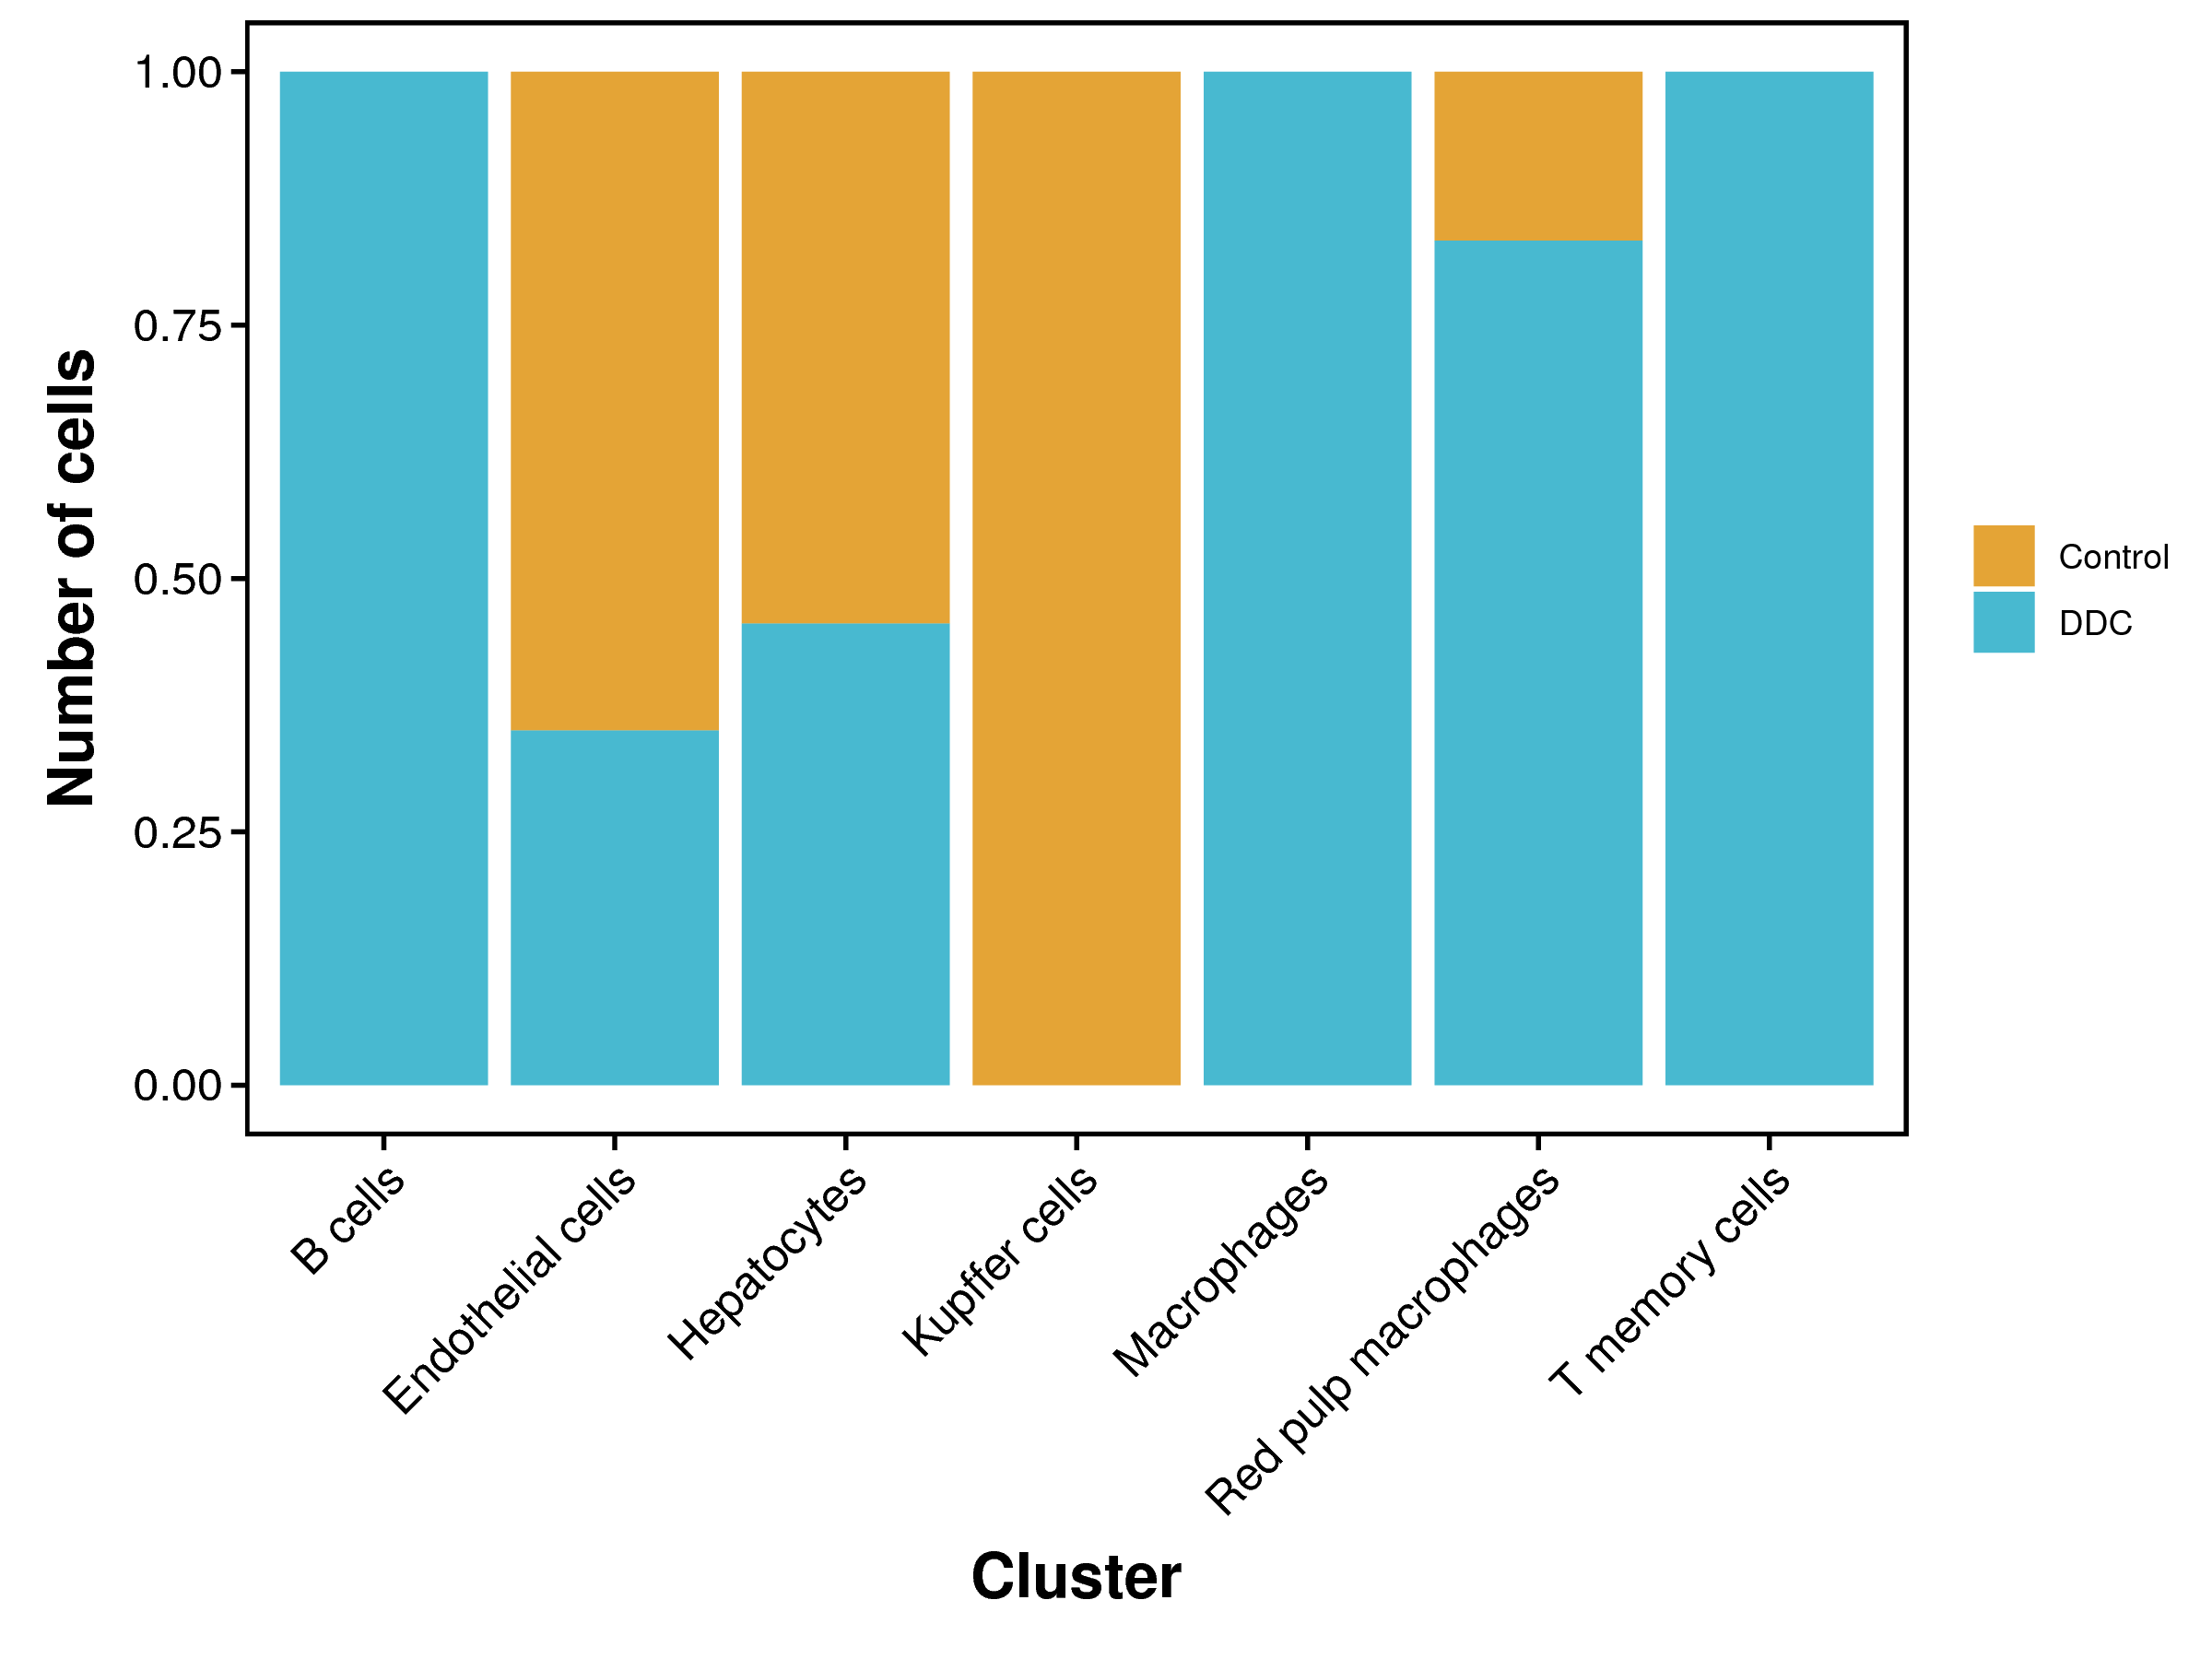
| Cluster | Control | DDC |
|---|---|---|
| Total | 14016 (100%) | 11721 (100%) |
| B cells | 0 (0%) | 2 (0.02%) |
| Endothelial cells | 26 (0.19%) | 14 (0.12%) |
| Hepatocytes | 13988 (99.8%) | 11697 (99.8%) |
| Kupffer cells | 1 (0.01%) | 0 (0%) |
| Macrophages | 0 (0%) | 2 (0.02%) |
| Red pulp macrophages | 1 (0.01%) | 5 (0.04%) |
| T memory cells | 0 (0%) | 1 (0.01%) |
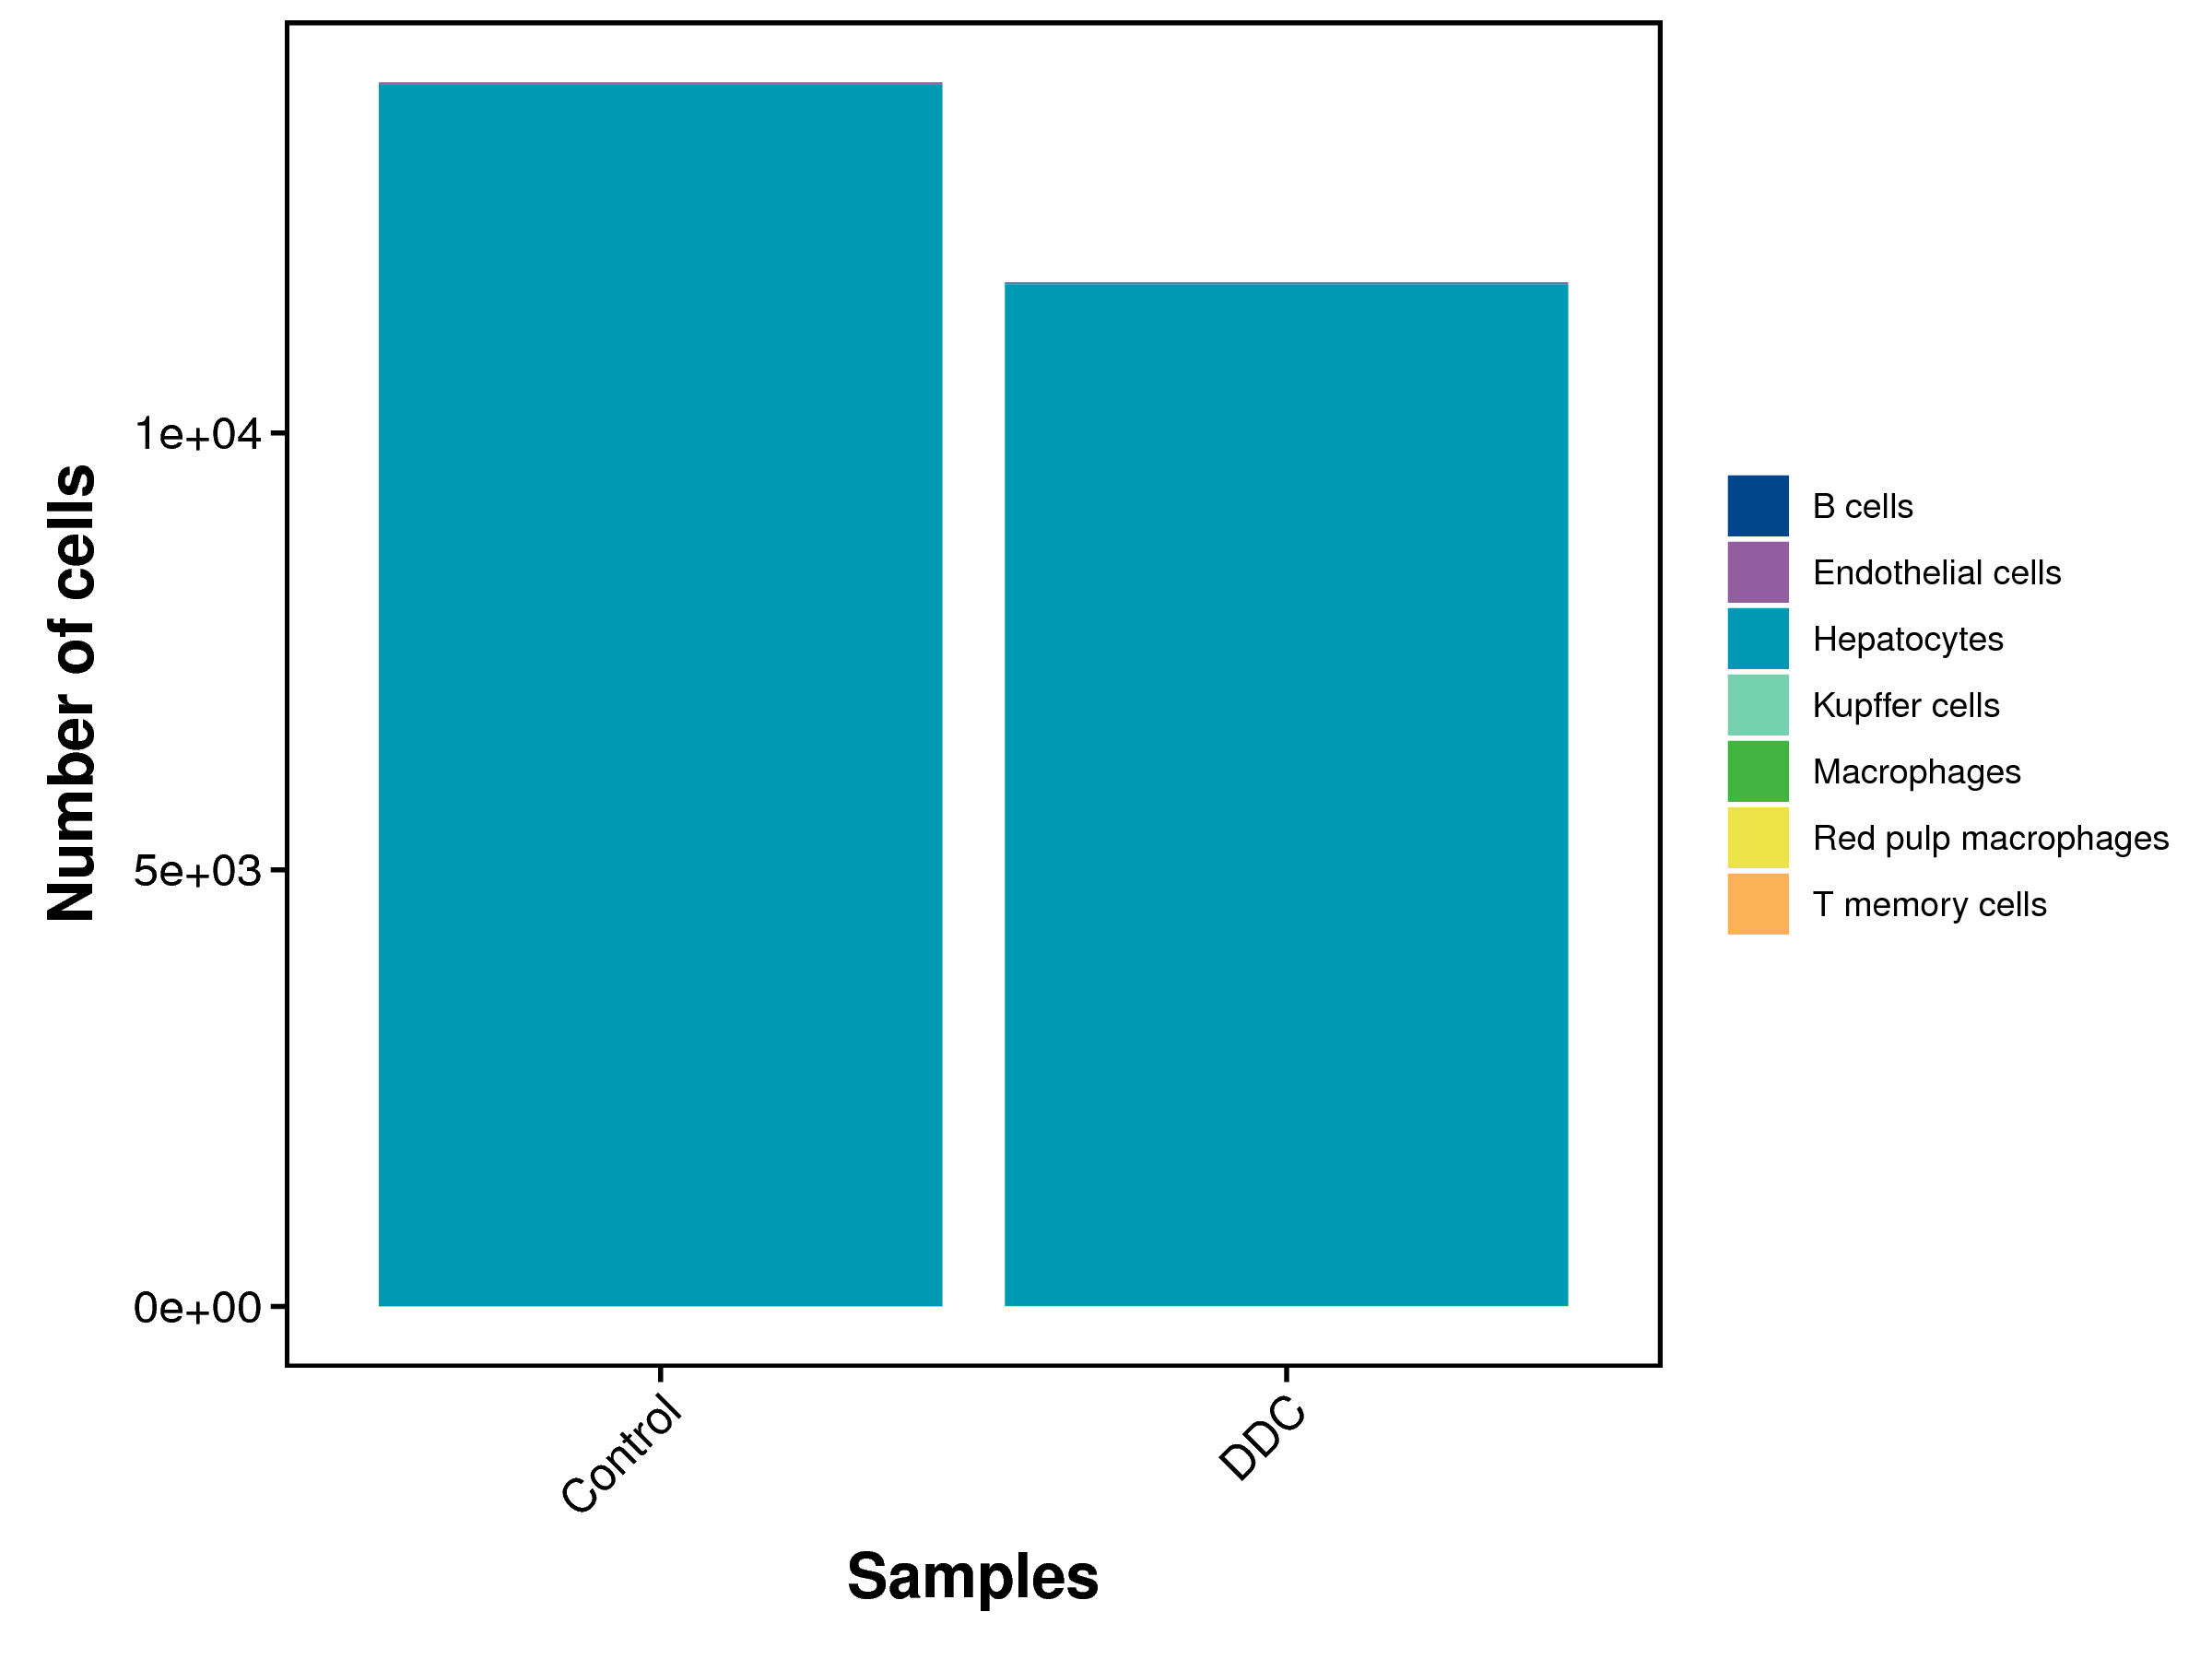 |
 |
|
| Fig 4-5-1 各样本中各细胞类型细胞数量堆叠图 | Fig 4-5-2 各样本中各细胞类型细胞数量百分比堆叠图 | |
 |
 |
|
| Fig 4-5-3 各细胞类型中各个样本细胞数量堆叠图 | Fig 4-5-4 各细胞类型中各个样本细胞数量百分比堆叠图 | |
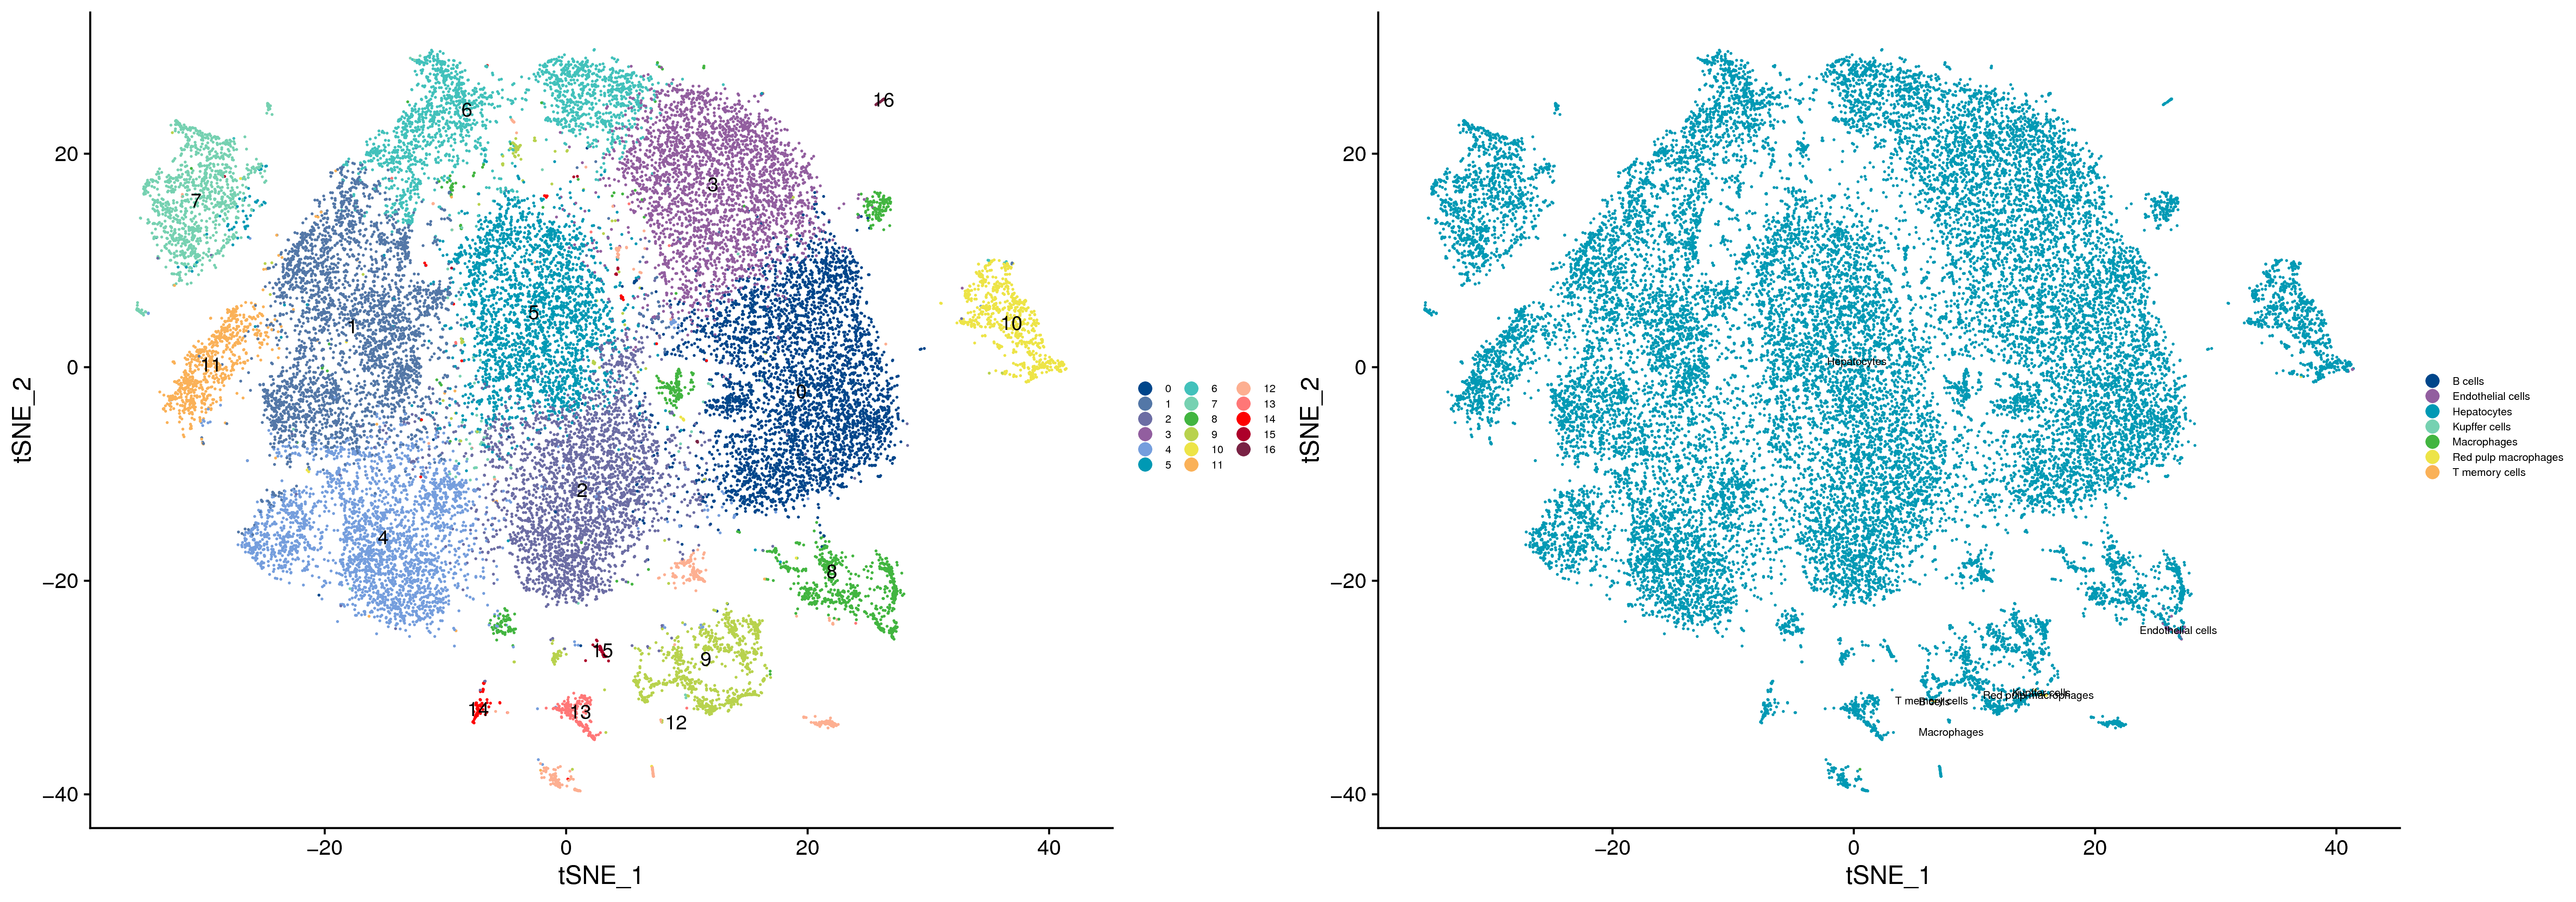 |
| Fig 4-5-5 各细胞类型在tSNE图的分布 |
各细胞亚群中各个细胞类型数量统计表:4.CellAnnotation/Cell.annotation.stat.xls
| Cluster | Cell.annotation (Maximum proportion) | B cells | Endothelial cells | Hepatocytes | Kupffer cells | Macrophages | Red pulp macrophages | T memory cells |
|---|---|---|---|---|---|---|---|---|
| 0 | Hepatocytes(100.00%) | 0(0.00%) | 0(0.00%) | 3904(100.00%) | 0(0.00%) | 0(0.00%) | 0(0.00%) | 0(0.00%) |
| 1 | Hepatocytes(100.00%) | 0(0.00%) | 0(0.00%) | 3327(100.00%) | 0(0.00%) | 0(0.00%) | 0(0.00%) | 0(0.00%) |
| 2 | Hepatocytes(100.00%) | 0(0.00%) | 0(0.00%) | 2919(100.00%) | 0(0.00%) | 0(0.00%) | 0(0.00%) | 0(0.00%) |
| 3 | Hepatocytes(100.00%) | 0(0.00%) | 0(0.00%) | 2875(100.00%) | 0(0.00%) | 0(0.00%) | 0(0.00%) | 0(0.00%) |
| 4 | Hepatocytes(100.00%) | 0(0.00%) | 0(0.00%) | 2729(100.00%) | 0(0.00%) | 0(0.00%) | 0(0.00%) | 0(0.00%) |
| 5 | Hepatocytes(100.00%) | 0(0.00%) | 0(0.00%) | 2633(100.00%) | 0(0.00%) | 0(0.00%) | 0(0.00%) | 0(0.00%) |
| 6 | Hepatocytes(100.00%) | 0(0.00%) | 0(0.00%) | 1918(100.00%) | 0(0.00%) | 0(0.00%) | 0(0.00%) | 0(0.00%) |
| 7 | Hepatocytes(100.00%) | 0(0.00%) | 0(0.00%) | 1159(100.00%) | 0(0.00%) | 0(0.00%) | 0(0.00%) | 0(0.00%) |
| 8 | Hepatocytes(96.42%) | 0(0.00%) | 37(3.58%) | 996(96.42%) | 0(0.00%) | 0(0.00%) | 0(0.00%) | 0(0.00%) |
| 9 | Hepatocytes(98.86%) | 2(0.21%) | 0(0.00%) | 954(98.86%) | 1(0.10%) | 2(0.21%) | 5(0.52%) | 1(0.10%) |
| 10 | Hepatocytes(99.44%) | 0(0.00%) | 3(0.42%) | 715(99.44%) | 0(0.00%) | 0(0.00%) | 1(0.14%) | 0(0.00%) |
| 11 | Hepatocytes(100.00%) | 0(0.00%) | 0(0.00%) | 698(100.00%) | 0(0.00%) | 0(0.00%) | 0(0.00%) | 0(0.00%) |
| 12 | Hepatocytes(100.00%) | 0(0.00%) | 0(0.00%) | 419(100.00%) | 0(0.00%) | 0(0.00%) | 0(0.00%) | 0(0.00%) |
| 13 | Hepatocytes(100.00%) | 0(0.00%) | 0(0.00%) | 217(100.00%) | 0(0.00%) | 0(0.00%) | 0(0.00%) | 0(0.00%) |
| 14 | Hepatocytes(100.00%) | 0(0.00%) | 0(0.00%) | 113(100.00%) | 0(0.00%) | 0(0.00%) | 0(0.00%) | 0(0.00%) |
| 15 | Hepatocytes(100.00%) | 0(0.00%) | 0(0.00%) | 68(100.00%) | 0(0.00%) | 0(0.00%) | 0(0.00%) | 0(0.00%) |
| 16 | Hepatocytes(100.00%) | 0(0.00%) | 0(0.00%) | 41(100.00%) | 0(0.00%) | 0(0.00%) | 0(0.00%) | 0(0.00%) |
 |
| Fig 4-5-6 Seurat分群与singleR细胞鉴定对应circos图 |
通过singleR,我们可以鉴定细胞的细胞类型;通过Seurat,我们可以得到细胞的聚类信息。通过这两个软件,我们可以将一组细胞按照细胞类型和细胞分群两种方式进行聚类。然后,我们计算各个细胞亚群的细胞与各个细胞类型的细胞之间的相关性,并绘制成热图,作为singleR细胞鉴定结果准确性的一个佐证。
 |
| Fig 4-5-7 Seurat分群与singleR鉴定细胞类型相关性热图 |
5 亚群上调表达基因分析
5.1 上调表达基因分析
为了了解各个细胞亚群的分子表达特征,我们可以筛选各个细胞亚群上调表达的基因。
采用Seurat的秩和检验分别对不同类细胞群进行基因差异表达分析,筛选亚群上调表达的基因。
上调基因的筛选条件为:
- 目标亚群或对照亚群中,基因在25%以上的细胞中有表达。
- P值 ≤0.01;
- 基因表达倍数log2FC≥0.36,即基因上调的倍数≥1.28。
| Cluster | 0 | 1 | 2 | 3 | 4 | 5 | 6 | 7 | 8 | 9 | 10 | 11 | 12 | 13 | 14 | 15 | 16 |
|---|---|---|---|---|---|---|---|---|---|---|---|---|---|---|---|---|---|
| Number of DE genes | 279 | 233 | 407 | 282 | 252 | 427 | 297 | 1084 | 172 | 217 | 194 | 411 | 428 | 209 | 474 | 336 | 614 |
 |
| Fig 5-1-1 各亚群上调基因数量统计柱状图 |
各亚群差异基因注释表: 3.MarkerGene/DeGene.list.xls
| Target_Cluster | Gene ID | Gene Name | Target_Cluster_mean | Other_Cluster_mean | Log2FC | Pvalue | Qvalue | Description | KEGG_A_class | KEGG_B_class | Pathway | K_ID | GO Component | GO Function | GO Process |
|---|---|---|---|---|---|---|---|---|---|---|---|---|---|---|---|
| 0 | ENSMUSG00000093662 | Gm20649 | 5.39179783686563 | 1.21929924534598 | 2.14471416284691 | 0 | 0 | predicted gene 20649 [Source:MGI Symbol;Acc:MGI:5313096] | - | - | - | - | - | - | - |
| 0 | ENSMUSG00000024694 | Keg1 | 7.5524857160343 | 2.18648843010038 | 1.78833583604121 | 0 | 0 | kidney expressed gene 1 [Source:MGI Symbol;Acc:MGI:1928492] | Metabolism | Amino acid metabolism | ko00360//Phenylalanine metabolism | K00628 | GO:0005737//cytoplasm;GO:0005739//mitochondrion;GO:0005813//centrosome;GO:0005815//microtubule organizing center;GO:0005856//cytoskeleton;GO:0005874//microtubule | GO:0016740//transferase activity;GO:0016746//transferase activity, transferring acyl groups;GO:0047961//glycine N-acyltransferase activity | - |
| 0 | ENSMUSG00000020122 | Egfr | 84.1681523671302 | 24.669406790099 | 1.77055142363162 | 0 | 0 | epidermal growth factor receptor [Source:MGI Symbol;Acc:MGI:95294] | Human Diseases;Human Diseases;Environmental Information Processing;Environmental Information Processing;Cellular Processes;Human Diseases;Environmental Information Processing;Cellular Processes;Environmental Information Processing;Human Diseases;Cellular Processes;Environmental Information Processing;Human Diseases;Environmental Information Processing;Human Diseases;Organismal Systems;Human Diseases;Human Diseases;Environmental Information Processing;Human Diseases;Organismal Systems;Human Diseases;Environmental Information Processing;Organismal Systems;Organismal Systems;Environmental Information Processing;Human Diseases;Human Diseases;Human Diseases;Organismal Systems;Human Diseases;Cellular Processes;Environmental Information Processing;Human Diseases;Human Diseases;Cellular Processes;Human Diseases;Human Diseases;Human Diseases;Human Diseases;Human Diseases;Human Diseases | Cancers;Infectious diseases;Signal transduction;Signal transduction;Transport and catabolism;Infectious diseases;Signal transduction;Cell motility;Signal transduction;Cancers;Cellular community - eukaryotes;Signal transduction;Cancers;Signal transduction;Endocrine and metabolic diseases;Endocrine system;Cancers;Cancers;Signal transduction;Cancers;Endocrine system;Infectious diseases;Signal transduction;Endocrine system;Endocrine system;Signal transduction;Cancers;Cancers;Drug resistance;Endocrine system;Cancers;Cellular community - eukaryotes;Signal transduction;Drug resistance;Cancers;Cellular community - eukaryotes;Cancers;Cancers;Cancers;Cancers;Cancers;Cancers | ko05200//Pathways in cancer;ko05165//Human papillomavirus infection;ko04151//PI3K-Akt signaling pathway;ko04010//MAPK signaling pathway;ko04144//Endocytosis;ko05163//Human cytomegalovirus infection;ko04014//Ras signaling pathway;ko04810//Regulation of actin cytoskeleton;ko04015//Rap1 signaling pathway;ko05205//Proteoglycans in cancer;ko04510//Focal adhesion;ko04020//Calcium signaling pathway;ko05225//Hepatocellular carcinoma;ko04630//Jak-STAT signaling pathway;ko04934//Cushing syndrome;ko04921//Oxytocin signaling pathway;ko05226//Gastric cancer;ko05224//Breast cancer;ko04072//Phospholipase D signaling pathway;ko05206//MicroRNAs in cancer;ko04915//Estrogen signaling pathway;ko05160//Hepatitis C;ko04068//FoxO signaling pathway;ko04926//Relaxin signaling pathway;ko04928//Parathyroid hormone synthesis, secretion and action;ko04066//HIF-1 signaling pathway;ko05231//Choline metabolism in cancer;ko05215//Prostate cancer;ko01522//Endocrine resistance;ko04912//GnRH signaling pathway;ko05210//Colorectal cancer;ko04540//Gap junction;ko04012//ErbB signaling pathway;ko01521//EGFR tyrosine kinase inhibitor resistance;ko05212//Pancreatic cancer;ko04520//Adherens junction;ko05218//Melanoma;ko05214//Glioma;ko05223//Non-small cell lung cancer;ko05230//Central carbon metabolism in cancer;ko05213//Endometrial cancer;ko05219//Bladder cancer | K04361;K04361;K04361;K04361;K04361;K04361;K04361;K04361;K04361;K04361;K04361;K04361;K04361;K04361;K04361;K04361;K04361;K04361;K04361;K04361;K04361;K04361;K04361;K04361;K04361;K04361;K04361;K04361;K04361;K04361;K04361;K04361;K04361;K04361;K04361;K04361;K04361;K04361;K04361;K04361;K04361;K04361 | GO:0000139//Golgi membrane;GO:0005634//nucleus;GO:0005737//cytoplasm;GO:0005768//endosome;GO:0005783//endoplasmic reticulum;GO:0005789//endoplasmic reticulum membrane;GO:0005794//Golgi apparatus;GO:0005886//plasma membrane;GO:0005887//integral component of plasma membrane;GO:0009925//basal plasma membrane;GO:0009986//cell surface;GO:0010008//endosome membrane;GO:0016020//membrane;GO:0016021//integral component of membrane;GO:0016323//basolateral plasma membrane;GO:0016324//apical plasma membrane;GO:0030139//endocytic vesicle;GO:0031901//early endosome membrane;GO:0031965//nuclear membrane;GO:0032991//macromolecular complex;GO:0043235//receptor complex;GO:0045121//membrane raft;GO:0045202//synapse;GO:0048471//perinuclear region of cytoplasm;GO:0097489//multivesicular body, internal vesicle lumen | GO:0000166//nucleotide binding;GO:0003682//chromatin binding;GO:0004672//protein kinase activity;GO:0004713//protein tyrosine kinase activity;GO:0004714//transmembrane receptor protein tyrosine kinase activity;GO:0004888//transmembrane signaling receptor activity;GO:0005006//epidermal growth factor-activated receptor activity;GO:0005102//receptor binding;GO:0005178//integrin binding;GO:0005515//protein binding;GO:0005516//calmodulin binding;GO:0005524//ATP binding;GO:0016301//kinase activity;GO:0016740//transferase activity;GO:0019899//enzyme binding;GO:0019901//protein kinase binding;GO:0019903//protein phosphatase binding;GO:0030235//nitric-oxide synthase regulator activity;GO:0031625//ubiquitin protein ligase binding;GO:0042802//identical protein binding;GO:0046982//protein heterodimerization activity;GO:0048408//epidermal growth factor binding;GO:0051015//actin filament binding | GO:0000186//activation of MAPKK activity;GO:0000902//cell morphogenesis;GO:0001889//liver development;GO:0001892//embryonic placenta development;GO:0001934//positive regulation of protein phosphorylation;GO:0001942//hair follicle development;GO:0006412//translation;GO:0006468//protein phosphorylation;GO:0006970//response to osmotic stress;GO:0006979//response to oxidative stress;GO:0007165//signal transduction;GO:0007166//cell surface receptor signaling pathway;GO:0007169//transmembrane receptor protein tyrosine kinase signaling pathway;GO:0007173//epidermal growth factor receptor signaling pathway;GO:0007275//multicellular organism development;GO:0007435//salivary gland morphogenesis;GO:0007494//midgut development;GO:0007611//learning or memory;GO:0007623//circadian rhythm;GO:0008283//cell proliferation;GO:0008284//positive regulation of cell proliferation;GO:0008544//epidermis development;GO:0010750//positive regulation of nitric oxide mediated signal transduction;GO:0010960//magnesium ion homeostasis;GO:0014066//regulation of phosphatidylinositol 3-kinase signaling;GO:0014070//response to organic cyclic compound;GO:0016101//diterpenoid metabolic process;GO:0016310//phosphorylation;GO:0018108//peptidyl-tyrosine phosphorylation;GO:0021795//cerebral cortex cell migration;GO:0030154//cell differentiation;GO:0030307//positive regulation of cell growth;GO:0030324//lung development;GO:0030335//positive regulation of cell migration;GO:0032355//response to estradiol;GO:0032930//positive regulation of superoxide anion generation;GO:0033138//positive regulation of peptidyl-serine phosphorylation;GO:0033590//response to cobalamin;GO:0033594//response to hydroxyisoflavone;GO:0033993//response to lipid;GO:0034614//cellular response to reactive oxygen species;GO:0035556//intracellular signal transduction;GO:0035690//cellular response to drug;GO:0038083//peptidyl-tyrosine autophosphorylation;GO:0042060//wound healing;GO:0042127//regulation of cell proliferation;GO:0042177//negative regulation of protein catabolic process;GO:0042327//positive regulation of phosphorylation;GO:0042698//ovulation cycle;GO:0042743//hydrogen peroxide metabolic process;GO:0043066//negative regulation of apoptotic process;GO:0043406//positive regulation of MAP kinase activity;GO:0043586//tongue development;GO:0045737//positive regulation of cyclin-dependent protein serine/threonine kinase activity;GO:0045739//positive regulation of DNA repair;GO:0045740//positive regulation of DNA replication;GO:0045780//positive regulation of bone resorption;GO:0045893//positive regulation of transcription, DNA-templated;GO:0045907//positive regulation of vasoconstriction;GO:0045930//negative regulation of mitotic cell cycle;GO:0045944//positive regulation of transcription from RNA polymerase II promoter;GO:0046328//regulation of JNK cascade;GO:0046777//protein autophosphorylation;GO:0048143//astrocyte activation;GO:0048146//positive regulation of fibroblast proliferation;GO:0048546//digestive tract morphogenesis;GO:0048661//positive regulation of smooth muscle cell proliferation;GO:0048812//neuron projection morphogenesis;GO:0050679//positive regulation of epithelial cell proliferation;GO:0050729//positive regulation of inflammatory response;GO:0050730//regulation of peptidyl-tyrosine phosphorylation;GO:0050999//regulation of nitric-oxide synthase activity;GO:0051592//response to calcium ion;GO:0051897//positive regulation of protein kinase B signaling;GO:0051968//positive regulation of synaptic transmission, glutamatergic;GO:0060571//morphogenesis of an epithelial fold;GO:0061029//eyelid development in camera-type eye;GO:0070141//response to UV-A;GO:0070372//regulation of ERK1 and ERK2 cascade;GO:0070374//positive regulation of ERK1 and ERK2 cascade;GO:0071230//cellular response to amino acid stimulus;GO:0071260//cellular response to mechanical stimulus;GO:0071276//cellular response to cadmium ion;GO:0071363//cellular response to growth factor stimulus;GO:0071364//cellular response to epidermal growth factor stimulus;GO:0071392//cellular response to estradiol stimulus;GO:0071549//cellular response to dexamethasone stimulus;GO:0090263//positive regulation of canonical Wnt signaling pathway;GO:0097421//liver regeneration;GO:0098609//cell-cell adhesion;GO:1900020//positive regulation of protein kinase C activity;GO:1900087//positive regulation of G1/S transition of mitotic cell cycle;GO:1901224//positive regulation of NIK/NF-kappaB signaling;GO:1902722//positive regulation of prolactin secretion;GO:1902966//positive regulation of protein localization to early endosome;GO:1903078//positive regulation of protein localization to plasma membrane;GO:1903800//positive regulation of production of miRNAs involved in gene silencing by miRNA |
| 0 | ENSMUSG00000041237 | Pklr | 5.0423076807912 | 1.49420378263806 | 1.75470723458464 | 0 | 0 | pyruvate kinase liver and red blood cell [Source:MGI Symbol;Acc:MGI:97604] | Metabolism;Metabolism;Human Diseases;Organismal Systems;Metabolism;Metabolism;Metabolism;Human Diseases;Metabolism;Human Diseases | Global and overview maps;Nucleotide metabolism;Endocrine and metabolic diseases;Endocrine system;Global and overview maps;Global and overview maps;Carbohydrate metabolism;Endocrine and metabolic diseases;Carbohydrate metabolism;Endocrine and metabolic diseases | ko01100//Metabolic pathways;ko00230//Purine metabolism;ko04932//Non-alcoholic fatty liver disease (NAFLD);ko04910//Insulin signaling pathway;ko01200//Carbon metabolism;ko01230//Biosynthesis of amino acids;ko00010//Glycolysis / Gluconeogenesis;ko04930//Type II diabetes mellitus;ko00620//Pyruvate metabolism;ko04950//Maturity onset diabetes of the young | K12406;K12406;K12406;K12406;K12406;K12406;K12406;K12406;K12406;K12406 | GO:0005829//cytosol | GO:0000287//magnesium ion binding;GO:0003824//catalytic activity;GO:0004743//pyruvate kinase activity;GO:0016301//kinase activity;GO:0016740//transferase activity;GO:0030955//potassium ion binding | GO:0001666//response to hypoxia;GO:0005975//carbohydrate metabolic process;GO:0006096//glycolytic process;GO:0006754//ATP biosynthetic process;GO:0007584//response to nutrient;GO:0009408//response to heat;GO:0009749//response to glucose;GO:0010038//response to metal ion;GO:0010226//response to lithium ion;GO:0016310//phosphorylation;GO:0032869//cellular response to insulin stimulus;GO:0033198//response to ATP;GO:0042866//pyruvate biosynthetic process;GO:0051591//response to cAMP;GO:0071872//cellular response to epinephrine stimulus |
| 0 | ENSMUSG00000113543 | Gm36264 | 4.24923165580866 | 1.31369931749591 | 1.69356689124882 | 0 | 0 | predicted gene, 36264 [Source:MGI Symbol;Acc:MGI:5595423] | - | - | - | - | - | - | - |
| 0 | ENSMUSG00000062181 | Ces3b | 18.5789611834478 | 5.77972775961008 | 1.68459639300092 | 0 | 0 | carboxylesterase 3B [Source:MGI Symbol;Acc:MGI:3644960] | - | - | - | - | GO:0005615//extracellular space;GO:0005783//endoplasmic reticulum;GO:0005788//endoplasmic reticulum lumen | GO:0004771//sterol esterase activity;GO:0004806//triglyceride lipase activity;GO:0016787//hydrolase activity;GO:0052689//carboxylic ester hydrolase activity;GO:0080030//methyl indole-3-acetate esterase activity | GO:0016042//lipid catabolic process |
| 0 | ENSMUSG00000020053 | Igf1 | 19.8776003196012 | 6.28516701893519 | 1.66112061343126 | 0 | 0 | insulin-like growth factor 1 [Source:MGI Symbol;Acc:MGI:96432] | Human Diseases;Environmental Information Processing;Environmental Information Processing;Environmental Information Processing;Environmental Information Processing;Human Diseases;Cellular Processes;Human Diseases;Environmental Information Processing;Human Diseases;Cellular Processes;Environmental Information Processing;Environmental Information Processing;Organismal Systems;Cellular Processes;Environmental Information Processing;Human Diseases;Human Diseases;Organismal Systems;Organismal Systems;Human Diseases;Human Diseases;Human Diseases;Human Diseases;Cellular Processes;Human Diseases;Organismal Systems;Organismal Systems;Organismal Systems;Organismal Systems | Cancers;Signal transduction;Signal transduction;Signal transduction;Signal transduction;Cancers;Cellular community - eukaryotes;Cancers;Signal transduction;Cancers;Cellular community - eukaryotes;Signal transduction;Signal transduction;Sensory system;Cell growth and death;Signal transduction;Cancers;Drug resistance;Aging;Endocrine system;Cardiovascular diseases;Cardiovascular diseases;Drug resistance;Cancers;Cell growth and death;Cancers;Aging;Nervous system;Endocrine system;Excretory system | ko05200//Pathways in cancer;ko04151//PI3K-Akt signaling pathway;ko04010//MAPK signaling pathway;ko04014//Ras signaling pathway;ko04015//Rap1 signaling pathway;ko05205//Proteoglycans in cancer;ko04510//Focal adhesion;ko05202//Transcriptional misregulation in cancers;ko04150//mTOR signaling pathway;ko05224//Breast cancer;ko04550//Signaling pathways regulating pluripotency of stem cells;ko04068//FoxO signaling pathway;ko04152//AMPK signaling pathway;ko04750//Inflammatory mediator regulation of TRP channels;ko04114//Oocyte meiosis;ko04066//HIF-1 signaling pathway;ko05215//Prostate cancer;ko01522//Endocrine resistance;ko04211//Longevity regulating pathway - mammal;ko04914//Progesterone-mediated oocyte maturation;ko05414//Dilated cardiomyopathy (DCM);ko05410//Hypertrophic cardiomyopathy (HCM);ko01521//EGFR tyrosine kinase inhibitor resistance;ko05218//Melanoma;ko04115//p53 signaling pathway;ko05214//Glioma;ko04213//Longevity regulating pathway - multiple species;ko04730//Long-term depression;ko04913//Ovarian Steroidogenesis;ko04960//Aldosterone-regulated sodium reabsorption | K05459;K05459;K05459;K05459;K05459;K05459;K05459;K05459;K05459;K05459;K05459;K05459;K05459;K05459;K05459;K05459;K05459;K05459;K05459;K05459;K05459;K05459;K05459;K05459;K05459;K05459;K05459;K05459;K05459;K05459 | GO:0005576//extracellular region;GO:0005614//interstitial matrix;GO:0005615//extracellular space;GO:0005737//cytoplasm;GO:0005886//plasma membrane;GO:0031091//platelet alpha granule;GO:0035867//alphav-beta3 integrin-IGF-1-IGF1R complex;GO:0042567//insulin-like growth factor ternary complex;GO:0043025//neuronal cell body;GO:0070382//exocytic vesicle | GO:0005158//insulin receptor binding;GO:0005159//insulin-like growth factor receptor binding;GO:0005178//integrin binding;GO:0005179//hormone activity;GO:0005496//steroid binding;GO:0005515//protein binding;GO:0008083//growth factor activity;GO:0043539//protein serine/threonine kinase activator activity | GO:0000187//activation of MAPK activity;GO:0001649//osteoblast differentiation;GO:0001775//cell activation;GO:0001932//regulation of protein phosphorylation;GO:0001974//blood vessel remodeling;GO:0002683//negative regulation of immune system process;GO:0006417//regulation of translation;GO:0007165//signal transduction;GO:0007399//nervous system development;GO:0007608//sensory perception of smell;GO:0007613//memory;GO:0007623//circadian rhythm;GO:0008283//cell proliferation;GO:0008284//positive regulation of cell proliferation;GO:0008285//negative regulation of cell proliferation;GO:0009408//response to heat;GO:0010001//glial cell differentiation;GO:0010468//regulation of gene expression;GO:0010560//positive regulation of glycoprotein biosynthetic process;GO:0010613//positive regulation of cardiac muscle hypertrophy;GO:0010628//positive regulation of gene expression;GO:0010629//negative regulation of gene expression;GO:0010656//negative regulation of muscle cell apoptotic process;GO:0014065//phosphatidylinositol 3-kinase signaling;GO:0014068//positive regulation of phosphatidylinositol 3-kinase signaling;GO:0014834//skeletal muscle satellite cell maintenance involved in skeletal muscle regeneration;GO:0014896//muscle hypertrophy;GO:0014904//myotube cell development;GO:0014911//positive regulation of smooth muscle cell migration;GO:0021940//positive regulation of cerebellar granule cell precursor proliferation;GO:0030104//water homeostasis;GO:0030166//proteoglycan biosynthetic process;GO:0030307//positive regulation of cell growth;GO:0030324//lung development;GO:0030335//positive regulation of cell migration;GO:0030879//mammary gland development;GO:0031017//exocrine pancreas development;GO:0031643//positive regulation of myelination;GO:0032148//activation of protein kinase B activity;GO:0032691//negative regulation of interleukin-1 beta production;GO:0032720//negative regulation of tumor necrosis factor production;GO:0032878//regulation of establishment or maintenance of cell polarity;GO:0034392//negative regulation of smooth muscle cell apoptotic process;GO:0035264//multicellular organism growth;GO:0035630//bone mineralization involved in bone maturation;GO:0040014//regulation of multicellular organism growth;GO:0042104//positive regulation of activated T cell proliferation;GO:0042127//regulation of cell proliferation;GO:0042531//positive regulation of tyrosine phosphorylation of STAT protein;GO:0043066//negative regulation of apoptotic process;GO:0043154//negative regulation of cysteine-type endopeptidase activity involved in apoptotic process;GO:0043388//positive regulation of DNA binding;GO:0043410//positive regulation of MAPK cascade;GO:0043491//protein kinase B signaling;GO:0043536//positive regulation of blood vessel endothelial cell migration;GO:0043568//positive regulation of insulin-like growth factor receptor signaling pathway;GO:0045428//regulation of nitric oxide biosynthetic process;GO:0045445//myoblast differentiation;GO:0045471//response to ethanol;GO:0045600//positive regulation of fat cell differentiation;GO:0045669//positive regulation of osteoblast differentiation;GO:0045725//positive regulation of glycogen biosynthetic process;GO:0045821//positive regulation of glycolytic process;GO:0045840//positive regulation of mitotic nuclear division;GO:0045893//positive regulation of transcription, DNA-templated;GO:0045944//positive regulation of transcription from RNA polymerase II promoter;GO:0046326//positive regulation of glucose import;GO:0046579//positive regulation of Ras protein signal transduction;GO:0048009//insulin-like growth factor receptor signaling pathway;GO:0048015//phosphatidylinositol-mediated signaling;GO:0048146//positive regulation of fibroblast proliferation;GO:0048286//lung alveolus development;GO:0048468//cell development;GO:0048661//positive regulation of smooth muscle cell proliferation;GO:0048754//branching morphogenesis of an epithelial tube;GO:0048839//inner ear development;GO:0050650//chondroitin sulfate proteoglycan biosynthetic process;GO:0050679//positive regulation of epithelial cell proliferation;GO:0050714//positive regulation of protein secretion;GO:0050731//positive regulation of peptidyl-tyrosine phosphorylation;GO:0050732//negative regulation of peptidyl-tyrosine phosphorylation;GO:0050821//protein stabilization;GO:0050974//detection of mechanical stimulus involved in sensory perception;GO:0051246//regulation of protein metabolic process;GO:0051450//myoblast proliferation;GO:0051897//positive regulation of protein kinase B signaling;GO:0051924//regulation of calcium ion transport;GO:0060252//positive regulation of glial cell proliferation;GO:0060283//negative regulation of oocyte development;GO:0060426//lung vasculature development;GO:0060463//lung lobe morphogenesis;GO:0060509//Type I pneumocyte differentiation;GO:0060510//Type II pneumocyte differentiation;GO:0060527//prostate epithelial cord arborization involved in prostate glandular acinus morphogenesis;GO:0060736//prostate gland growth;GO:0060740//prostate gland epithelium morphogenesis;GO:0060741//prostate gland stromal morphogenesis;GO:0060766//negative regulation of androgen receptor signaling pathway;GO:0061051//positive regulation of cell growth involved in cardiac muscle cell development;GO:0070371//ERK1 and ERK2 cascade;GO:0070373//negative regulation of ERK1 and ERK2 cascade;GO:0070886//positive regulation of calcineurin-NFAT signaling cascade;GO:0071333//cellular response to glucose stimulus;GO:0071902//positive regulation of protein serine/threonine kinase activity;GO:0090031//positive regulation of steroid hormone biosynthetic process;GO:0090201//negative regulation of release of cytochrome c from mitochondria;GO:0097192//extrinsic apoptotic signaling pathway in absence of ligand;GO:1900142//negative regulation of oligodendrocyte apoptotic process;GO:1901215//negative regulation of neuron death;GO:1902430//negative regulation of beta-amyloid formation;GO:1904075//positive regulation of trophectodermal cell proliferation;GO:1904193//negative regulation of cholangiocyte apoptotic process;GO:1904646//cellular response to beta-amyloid;GO:1904707//positive regulation of vascular smooth muscle cell proliferation;GO:1990314//cellular response to insulin-like growth factor stimulus;GO:2000288//positive regulation of myoblast proliferation;GO:2000679//positive regulation of transcription regulatory region DNA binding;GO:2001237//negative regulation of extrinsic apoptotic signaling pathway |
| 0 | ENSMUSG00000022762 | Ncam2 | 3.7370164140795 | 1.21681149872359 | 1.61878120893957 | 0 | 0 | neural cell adhesion molecule 2 [Source:MGI Symbol;Acc:MGI:97282] | Environmental Information Processing;Human Diseases | Signaling molecules and interaction;Neurodegenerative diseases | ko04514//Cell adhesion molecules (CAMs);ko05020//Prion diseases | K06491;K06491 | GO:0005886//plasma membrane;GO:0016020//membrane;GO:0016021//integral component of membrane;GO:0016604//nuclear body;GO:0030424//axon;GO:0031225//anchored component of membrane | GO:0005515//protein binding;GO:0042802//identical protein binding | GO:0007155//cell adhesion;GO:0007413//axonal fasciculation;GO:0007608//sensory perception of smell |
| 0 | ENSMUSG00000020593 | Lpin1 | 9.27139132110663 | 3.55961143616909 | 1.38106608809345 | 0 | 0 | lipin 1 [Source:MGI Symbol;Acc:MGI:1891340] | Metabolism;Environmental Information Processing;Metabolism;Metabolism | Global and overview maps;Signal transduction;Lipid metabolism;Lipid metabolism | ko01100//Metabolic pathways;ko04150//mTOR signaling pathway;ko00564//Glycerophospholipid metabolism;ko00561//Glycerolipid metabolism | K15728;K15728;K15728;K15728 | - | GO:0008195//phosphatidate phosphatase activity | GO:0006357//regulation of transcription from RNA polymerase II promoter;GO:0009062//fatty acid catabolic process;GO:0016311//dephosphorylation;GO:0019432//triglyceride biosynthetic process;GO:0031100//organ regeneration;GO:0032869//cellular response to insulin stimulus |
| 0 | ENSMUSG00000026365 | Cfh | 20.1088067680522 | 8.09982278021477 | 1.31186522836734 | 0 | 0 | complement component factor h [Source:MGI Symbol;Acc:MGI:88385] | Organismal Systems;Human Diseases | Immune system;Infectious diseases | ko04610//Complement and coagulation cascades;ko05150//Staphylococcus aureus infection | K04004;K04004 | GO:0005576//extracellular region;GO:0005615//extracellular space;GO:0005634//nucleus;GO:0005737//cytoplasm;GO:0005886//plasma membrane | GO:0001851//complement component C3b binding;GO:0005515//protein binding;GO:0008201//heparin binding;GO:0043395//heparan sulfate proteoglycan binding | GO:0002376//immune system process;GO:0006956//complement activation;GO:0006957//complement activation, alternative pathway;GO:0030449//regulation of complement activation;GO:0045087//innate immune response;GO:0045919//positive regulation of cytolysis;GO:1903659//regulation of complement-dependent cytotoxicity |
| 0 | ENSMUSG00000074882 | Cyp2c68 | 7.71451743031636 | 3.34002335850798 | 1.20771772181979 | 0 | 0 | cytochrome P450, family 2, subfamily c, polypeptide 68 [Source:MGI Symbol;Acc:MGI:3612287] | Metabolism;Organismal Systems;Organismal Systems;Human Diseases;Metabolism;Metabolism;Metabolism;Metabolism | Global and overview maps;Nervous system;Sensory system;Cancers;Metabolism of cofactors and vitamins;Lipid metabolism;Lipid metabolism;Lipid metabolism | ko01100//Metabolic pathways;ko04726//Serotonergic synapse;ko04750//Inflammatory mediator regulation of TRP channels;ko05204//Chemical carcinogenesis;ko00830//Retinol metabolism;ko00590//Arachidonic acid metabolism;ko00140//Steroid hormone biosynthesis;ko00591//Linoleic acid metabolism | K07413;K07413;K07413;K07413;K07413;K07413;K07413;K07413 | GO:0005737//cytoplasm;GO:0043231//intracellular membrane-bounded organelle | GO:0004497//monooxygenase activity;GO:0005506//iron ion binding;GO:0008392//arachidonic acid epoxygenase activity;GO:0008395//steroid hydroxylase activity;GO:0016491//oxidoreductase activity;GO:0016705//oxidoreductase activity, acting on paired donors, with incorporation or reduction of molecular oxygen;GO:0016712//oxidoreductase activity, acting on paired donors, with incorporation or reduction of molecular oxygen, reduced flavin or flavoprotein as one donor, and incorporation of one atom of oxygen;GO:0020037//heme binding;GO:0046872//metal ion binding | GO:0006082//organic acid metabolic process;GO:0006805//xenobiotic metabolic process;GO:0019373//epoxygenase P450 pathway;GO:0042738//exogenous drug catabolic process;GO:0055114//oxidation-reduction process |
| 0 | ENSMUSG00000028603 | Scp2 | 8.13713729508466 | 3.59260619893723 | 1.17949052901484 | 0 | 0 | sterol carrier protein 2, liver [Source:MGI Symbol;Acc:MGI:98254] | Metabolism;Organismal Systems;Cellular Processes;Metabolism | Global and overview maps;Endocrine system;Transport and catabolism;Lipid metabolism | ko01100//Metabolic pathways;ko03320//PPAR signaling pathway;ko04146//Peroxisome;ko00120//Primary bile acid biosynthesis | K08764;K08764;K08764;K08764 | GO:0005634//nucleus;GO:0005654//nucleoplasm;GO:0005737//cytoplasm;GO:0005739//mitochondrion;GO:0005777//peroxisome;GO:0005782//peroxisomal matrix;GO:0005783//endoplasmic reticulum;GO:0005829//cytosol;GO:0016020//membrane;GO:0019898//extrinsic component of membrane;GO:0031315//extrinsic component of mitochondrial outer membrane;GO:0032991//macromolecular complex;GO:0043231//intracellular membrane-bounded organelle | GO:0000062//fatty-acyl-CoA binding;GO:0003824//catalytic activity;GO:0003988//acetyl-CoA C-acyltransferase activity;GO:0005102//receptor binding;GO:0005515//protein binding;GO:0008289//lipid binding;GO:0008525//phosphatidylcholine transporter activity;GO:0008526//phosphatidylinositol transporter activity;GO:0015485//cholesterol binding;GO:0016740//transferase activity;GO:0016746//transferase activity, transferring acyl groups;GO:0016747//transferase activity, transferring acyl groups other than amino-acyl groups;GO:0033814//propanoyl-CoA C-acyltransferase activity;GO:0036042//long-chain fatty acyl-CoA binding;GO:0042803//protein homodimerization activity;GO:0046982//protein heterodimerization activity;GO:0050632//propionyl-CoA C2-trimethyltridecanoyltransferase activity;GO:0070538//oleic acid binding;GO:1904121//phosphatidylethanolamine transporter activity | GO:0006637//acyl-CoA metabolic process;GO:0006694//steroid biosynthetic process;GO:0006701//progesterone biosynthetic process;GO:0006869//lipid transport;GO:0007031//peroxisome organization;GO:0007568//aging;GO:0010893//positive regulation of steroid biosynthetic process;GO:0015914//phospholipid transport;GO:0015918//sterol transport;GO:0032385//positive regulation of intracellular cholesterol transport;GO:0032959//inositol trisphosphate biosynthetic process;GO:0043065//positive regulation of apoptotic process;GO:0045542//positive regulation of cholesterol biosynthetic process;GO:0045940//positive regulation of steroid metabolic process;GO:0072659//protein localization to plasma membrane;GO:1901373//lipid hydroperoxide transport;GO:1904109//positive regulation of cholesterol import |
| 0 | ENSMUSG00000031767 | Nudt7 | 9.52695801748522 | 4.32794533459315 | 1.13833335448987 | 0 | 0 | nudix (nucleoside diphosphate linked moiety X)-type motif 7 [Source:MGI Symbol;Acc:MGI:1914778] | Cellular Processes | Transport and catabolism | ko04146//Peroxisome | K17879 | GO:0005777//peroxisome | GO:0000287//magnesium ion binding;GO:0003723//RNA binding;GO:0003986//acetyl-CoA hydrolase activity;GO:0016787//hydrolase activity;GO:0016818//hydrolase activity, acting on acid anhydrides, in phosphorus-containing anhydrides;GO:0030145//manganese ion binding;GO:0030515//snoRNA binding;GO:0046872//metal ion binding | GO:0009132//nucleoside diphosphate metabolic process;GO:0015938//coenzyme A catabolic process;GO:0046356//acetyl-CoA catabolic process;GO:0050873//brown fat cell differentiation |
| 0 | ENSMUSG00000022875 | Kng1 | 17.4735287188832 | 8.21266428836591 | 1.0892487540671 | 0 | 0 | kininogen 1 [Source:MGI Symbol;Acc:MGI:1097705] | Organismal Systems | Immune system | ko04610//Complement and coagulation cascades | K03898 | GO:0005576//extracellular region;GO:0005615//extracellular space;GO:0005623//cell | GO:0004869//cysteine-type endopeptidase inhibitor activity;GO:0005102//receptor binding;GO:0030414//peptidase inhibitor activity | GO:0006954//inflammatory response;GO:0007204//positive regulation of cytosolic calcium ion concentration;GO:0007596//blood coagulation;GO:0007599//hemostasis;GO:0010466//negative regulation of peptidase activity;GO:0010951//negative regulation of endopeptidase activity;GO:0030195//negative regulation of blood coagulation;GO:0042311//vasodilation |
| 0 | ENSMUSG00000052974 | Cyp2f2 | 6.52961139606235 | 3.16631127209601 | 1.04419404346423 | 0 | 0 | cytochrome P450, family 2, subfamily f, polypeptide 2 [Source:MGI Symbol;Acc:MGI:88608] | Metabolism | Xenobiotics biodegradation and metabolism | ko00980//Metabolism of xenobiotics by cytochrome P450 | K07416 | GO:0005737//cytoplasm;GO:0005783//endoplasmic reticulum;GO:0005789//endoplasmic reticulum membrane;GO:0016020//membrane;GO:0031090//organelle membrane;GO:0043231//intracellular membrane-bounded organelle | GO:0004497//monooxygenase activity;GO:0005506//iron ion binding;GO:0008392//arachidonic acid epoxygenase activity;GO:0008395//steroid hydroxylase activity;GO:0016491//oxidoreductase activity;GO:0016705//oxidoreductase activity, acting on paired donors, with incorporation or reduction of molecular oxygen;GO:0016712//oxidoreductase activity, acting on paired donors, with incorporation or reduction of molecular oxygen, reduced flavin or flavoprotein as one donor, and incorporation of one atom of oxygen;GO:0019825//oxygen binding;GO:0020037//heme binding;GO:0046872//metal ion binding | GO:0006082//organic acid metabolic process;GO:0006805//xenobiotic metabolic process;GO:0009636//response to toxic substance;GO:0018931//naphthalene metabolic process;GO:0018979//trichloroethylene metabolic process;GO:0019373//epoxygenase P450 pathway;GO:0042738//exogenous drug catabolic process;GO:0055114//oxidation-reduction process |
| 0 | ENSMUSG00000016756 | Cmah | 19.2597005022956 | 10.3457810740611 | 0.896542700480929 | 0 | 0 | cytidine monophospho-N-acetylneuraminic acid hydroxylase [Source:MGI Symbol;Acc:MGI:103227] | Metabolism | Carbohydrate metabolism | ko00520//Amino sugar and nucleotide sugar metabolism | K08080 | GO:0005737//cytoplasm;GO:0005783//endoplasmic reticulum | GO:0016491//oxidoreductase activity;GO:0030338//CMP-N-acetylneuraminate monooxygenase activity;GO:0046872//metal ion binding;GO:0051536//iron-sulfur cluster binding;GO:0051537//2 iron, 2 sulfur cluster binding | GO:0006054//N-acetylneuraminate metabolic process;GO:0046381//CMP-N-acetylneuraminate metabolic process;GO:0055114//oxidation-reduction process |
| 0 | ENSMUSG00000052520 | Cyp2j5 | 18.9082201905403 | 10.536541523342 | 0.843612170798495 | 0 | 0 | cytochrome P450, family 2, subfamily j, polypeptide 5 [Source:MGI Symbol;Acc:MGI:1270149] | Metabolism;Organismal Systems;Organismal Systems;Metabolism;Organismal Systems;Metabolism | Global and overview maps;Nervous system;Sensory system;Lipid metabolism;Endocrine system;Lipid metabolism | ko01100//Metabolic pathways;ko04726//Serotonergic synapse;ko04750//Inflammatory mediator regulation of TRP channels;ko00590//Arachidonic acid metabolism;ko04913//Ovarian Steroidogenesis;ko00591//Linoleic acid metabolism | K07418;K07418;K07418;K07418;K07418;K07418 | GO:0005737//cytoplasm;GO:0005783//endoplasmic reticulum;GO:0005789//endoplasmic reticulum membrane;GO:0016020//membrane;GO:0016021//integral component of membrane;GO:0031090//organelle membrane;GO:0043231//intracellular membrane-bounded organelle | GO:0004497//monooxygenase activity;GO:0005506//iron ion binding;GO:0008395//steroid hydroxylase activity;GO:0016491//oxidoreductase activity;GO:0016705//oxidoreductase activity, acting on paired donors, with incorporation or reduction of molecular oxygen;GO:0016712//oxidoreductase activity, acting on paired donors, with incorporation or reduction of molecular oxygen, reduced flavin or flavoprotein as one donor, and incorporation of one atom of oxygen;GO:0020037//heme binding;GO:0046872//metal ion binding;GO:0070330//aromatase activity | GO:0001990//regulation of systemic arterial blood pressure by hormone;GO:0001998//angiotensin mediated vasoconstriction involved in regulation of systemic arterial blood pressure;GO:0006082//organic acid metabolic process;GO:0006805//xenobiotic metabolic process;GO:0042738//exogenous drug catabolic process;GO:0055114//oxidation-reduction process;GO:0097254//renal tubular secretion;GO:2000863//positive regulation of estrogen secretion |
| 0 | ENSMUSG00000086141 | 9030622O22Rik | 13.5001726531451 | 8.25974266224018 | 0.708809118623944 | 0 | 0 | RIKEN cDNA 9030622O22 gene [Source:MGI Symbol;Acc:MGI:1918820] | - | - | - | - | - | - | - |
| 0 | ENSMUSG00000024424 | Ttc39c | 26.351351638149 | 17.1499476818848 | 0.619672788543854 | 0 | 0 | tetratricopeptide repeat domain 39C [Source:MGI Symbol;Acc:MGI:1919997] | - | - | - | - | - | GO:0005515//protein binding | - |
| 0 | ENSMUSG00000022353 | Mtss1 | 21.7289636714792 | 14.3505789001121 | 0.598510432936547 | 0 | 0 | MTSS I-BAR domain containing 1 [Source:MGI Symbol;Acc:MGI:2384818] | - | - | - | - | GO:0015629//actin cytoskeleton | GO:0003779//actin binding;GO:0003785//actin monomer binding;GO:0005102//receptor binding;GO:0042802//identical protein binding | GO:0007009//plasma membrane organization;GO:0030036//actin cytoskeleton organization |
5.2 上调基因表达分布
图形是比表格更优秀的数据呈现形式。我们使用热图、tSNE图、密度分布图、小提琴图和气泡图来可视化基因在细胞和各个细胞亚群的表达分布情况。(选择亚群上调top5的基因用于绘图)
 |
| Fig 5-2-1 标记基因表达热图 |
 |
| Fig 5-2-2 标记基因表达分布气泡图 |
上调基因表达分布图只展示其中5个基因,其他top5的基因请浏览文件夹3.MarkerGene/Plots/ExpPlot
- 1810064F22Rik
- Abcc4
- Adgre1
- Adgrl4
- Adgrv1
Fig 5-2-3 标记基因表达分布图
上调基因表达分布密度图只展示其中5个基因,其他top5的基因请浏览文件夹3.MarkerGene/Plots/DensityPlot
- 1810064F22Rik
- Abcc4
- Adgre1
- Adgrl4
- Adgrv1
Fig 5-2-4 标记基因表达分布密度图
上调基因表达分布小提琴图只展示其中5个基因,其他top5的基因请浏览文件夹3.MarkerGene/Plots/ViolinPlot
- 1810064F22Rik
- Abcc4
- Adgre1
- Adgrl4
- Adgrv1
Fig 5-2-5 标记基因表达分布小提琴图
5.3 GO富集分析
Gene Ontology(简称GO)是一个国际标准化的基因功能分类体系,提供了一套动态更新的标准词汇表(controlled vocabulary)来全面描述生物体中基因和基因产物的属性。GO总共有三个ontology(本体),分别描述基因的分子功能(molecular function)、细胞组分(cellular component)、参与的生物过程(biological process)。GO的基本单位是term(词条、节点),每个term都对应一个属性。 GO功能分析一方面给出基因的GO功能分类注释;另一方面给出基因的GO功能显著性富集分析。 首先,我们将基因向GO数据库(http://www.geneontology.org/)的各term映射,并计算每个term的基因数,从而得到具有某个GO功能的基因列表及基因数目统计。然后应用超几何检验,找出与整个基因组背景相比,在基因中显著富集的GO条目。
GO富集圈图:(第一圈:富集前20的GOterm,圈外为基因数目的坐标尺。不同的颜色代表不同的Ontology; 第二圈:背景基因中该GOterm的数目以及Q值。基因越多条形越长,Q值越小颜色越红; 第三圈:该GOterm差异基因数量 第四圈:各GOterm的RichFactor值(该GOterm中差异数量除以所有数量),背景网格线,每一格代表0.1)
- Cluster_0 富集圈图
- Cluster_1 富集圈图
- Cluster_2 富集圈图
- Cluster_3 富集圈图
- Cluster_4 富集圈图
- Cluster_5 富集圈图
- Cluster_6 富集圈图
- Cluster_7 富集圈图
- Cluster_8 富集圈图
- Cluster_9 富集圈图
- Cluster_10 富集圈图
- Cluster_11 富集圈图
- Cluster_12 富集圈图
- Cluster_13 富集圈图
- Cluster_14 富集圈图
- Cluster_15 富集圈图
- Cluster_16 富集圈图
Fig 5-3-1 GO 富集圈图
GO 富集分类柱状图:(横坐标为二级GOterm,纵坐标为该term里的基因数量,不同颜色表色不同类型GOterm)
- Cluster_0
- Cluster_1
- Cluster_2
- Cluster_3
- Cluster_4
- Cluster_5
- Cluster_6
- Cluster_7
- Cluster_8
- Cluster_9
- Cluster_10
- Cluster_11
- Cluster_12
- Cluster_13
- Cluster_14
- Cluster_15
- Cluster_16
Fig 5-3-2 GO富集分类柱状图
GO富集气泡图:(利用Q值最小的前20个GOterm来作图,纵坐标为GOterm,横坐标为富集因子(该GOterm中差异数量除以所有数量),大小表示数量多少,颜色越红Q值越小)");
- Cluster_0.C 气泡图
- Cluster_0.F 气泡图
- Cluster_0.P 气泡图
- Cluster_1.C 气泡图
- Cluster_1.F 气泡图
- Cluster_1.P 气泡图
- Cluster_2.C 气泡图
- Cluster_2.F 气泡图
- Cluster_2.P 气泡图
- Cluster_3.C 气泡图
- Cluster_3.F 气泡图
- Cluster_3.P 气泡图
- Cluster_4.C 气泡图
- Cluster_4.F 气泡图
- Cluster_4.P 气泡图
- Cluster_5.C 气泡图
- Cluster_5.F 气泡图
- Cluster_5.P 气泡图
- Cluster_6.C 气泡图
- Cluster_6.F 气泡图
- Cluster_6.P 气泡图
- Cluster_7.C 气泡图
- Cluster_7.F 气泡图
- Cluster_7.P 气泡图
- Cluster_8.C 气泡图
- Cluster_8.F 气泡图
- Cluster_8.P 气泡图
- Cluster_9.C 气泡图
- Cluster_9.F 气泡图
- Cluster_9.P 气泡图
- Cluster_10.C 气泡图
- Cluster_10.F 气泡图
- Cluster_10.P 气泡图
- Cluster_11.C 气泡图
- Cluster_11.F 气泡图
- Cluster_11.P 气泡图
- Cluster_12.C 气泡图
- Cluster_12.F 气泡图
- Cluster_12.P 气泡图
- Cluster_13.C 气泡图
- Cluster_13.F 气泡图
- Cluster_13.P 气泡图
- Cluster_14.C 气泡图
- Cluster_14.F 气泡图
- Cluster_14.P 气泡图
- Cluster_15.C 气泡图
- Cluster_15.F 气泡图
- Cluster_15.P 气泡图
- Cluster_16.C 气泡图
- Cluster_16.F 气泡图
- Cluster_16.P 气泡图
Fig 5-3-3 GO富集气泡图
GO富集条形图:(利用Q值最小的前20个GOterm来作图,纵坐标为GOterm,横坐标为该GOterm数目占所有差异数目的百分比,颜色越深Q值越小,柱子上的数值为该GOterm数量及Q值");
- Cluster_0.C 富集柱形图
- Cluster_0.F 富集柱形图
- Cluster_0.P 富集柱形图
- Cluster_1.C 富集柱形图
- Cluster_1.F 富集柱形图
- Cluster_1.P 富集柱形图
- Cluster_2.C 富集柱形图
- Cluster_2.F 富集柱形图
- Cluster_2.P 富集柱形图
- Cluster_3.C 富集柱形图
- Cluster_3.F 富集柱形图
- Cluster_3.P 富集柱形图
- Cluster_4.C 富集柱形图
- Cluster_4.F 富集柱形图
- Cluster_4.P 富集柱形图
- Cluster_5.C 富集柱形图
- Cluster_5.F 富集柱形图
- Cluster_5.P 富集柱形图
- Cluster_6.C 富集柱形图
- Cluster_6.F 富集柱形图
- Cluster_6.P 富集柱形图
- Cluster_7.C 富集柱形图
- Cluster_7.F 富集柱形图
- Cluster_7.P 富集柱形图
- Cluster_8.C 富集柱形图
- Cluster_8.F 富集柱形图
- Cluster_8.P 富集柱形图
- Cluster_9.C 富集柱形图
- Cluster_9.F 富集柱形图
- Cluster_9.P 富集柱形图
- Cluster_10.C 富集柱形图
- Cluster_10.F 富集柱形图
- Cluster_10.P 富集柱形图
- Cluster_11.C 富集柱形图
- Cluster_11.F 富集柱形图
- Cluster_11.P 富集柱形图
- Cluster_12.C 富集柱形图
- Cluster_12.F 富集柱形图
- Cluster_12.P 富集柱形图
- Cluster_13.C 富集柱形图
- Cluster_13.F 富集柱形图
- Cluster_13.P 富集柱形图
- Cluster_14.C 富集柱形图
- Cluster_14.F 富集柱形图
- Cluster_14.P 富集柱形图
- Cluster_15.C 富集柱形图
- Cluster_15.F 富集柱形图
- Cluster_15.P 富集柱形图
- Cluster_16.C 富集柱形图
- Cluster_16.F 富集柱形图
- Cluster_16.P 富集柱形图
Fig 5-3-4 GO富集条形图
5.4 KO富集分析
在生物体内,不同基因相互协调行使其生物学,基于Pathway的分析有助于更进一步了解基因的生物学功能。KEGG是有关Pathway的主要公共数据库。 Pathway显著性富集分析以KEGG Pathway为单位,应用超几何检验,找出与整个基因组背景相比,在基因中显著性富集的Pathway。通过Pathway显著性富集能确定基因参与的最主要生化代谢途径和信号转导途径。
所有趋势pathway统计如下所示:
| Pathway | Pathway_ID | KEGG_A_class | KEGG_B_class | Cluster_0(157) | Cluster_0_Pvalue | Cluster_0_Qvalue | Cluster_1(121) | Cluster_1_Pvalue | Cluster_1_Qvalue | Cluster_10(86) | Cluster_10_Pvalue | Cluster_10_Qvalue | Cluster_11(202) | Cluster_11_Pvalue | Cluster_11_Qvalue | Cluster_12(242) | Cluster_12_Pvalue | Cluster_12_Qvalue | Cluster_13(103) | Cluster_13_Pvalue | Cluster_13_Qvalue | Cluster_14(284) | Cluster_14_Pvalue | Cluster_14_Qvalue | Cluster_15(176) | Cluster_15_Pvalue | Cluster_15_Qvalue | Cluster_16(219) | Cluster_16_Pvalue | Cluster_16_Qvalue | Cluster_2(200) | Cluster_2_Pvalue | Cluster_2_Qvalue | Cluster_3(152) | Cluster_3_Pvalue | Cluster_3_Qvalue | Cluster_4(124) | Cluster_4_Pvalue | Cluster_4_Qvalue | Cluster_5(212) | Cluster_5_Pvalue | Cluster_5_Qvalue | Cluster_6(170) | Cluster_6_Pvalue | Cluster_6_Qvalue | Cluster_7(507) | Cluster_7_Pvalue | Cluster_7_Qvalue | Cluster_8(77) | Cluster_8_Pvalue | Cluster_8_Qvalue | Cluster_9(108) | Cluster_9_Pvalue | Cluster_9_Qvalue |
|---|---|---|---|---|---|---|---|---|---|---|---|---|---|---|---|---|---|---|---|---|---|---|---|---|---|---|---|---|---|---|---|---|---|---|---|---|---|---|---|---|---|---|---|---|---|---|---|---|---|---|---|---|---|---|
| 2-Oxocarboxylic acid metabolism | ko01210 | Metabolism | Global and overview maps | 2 | 0.05334817 | 2.405319e-01 | 1 | 0.2533685 | 7.568349e-01 | 0 | 1 | 1 | 1 | 0.3875688 | 9.851618e-01 | 1 | 0.4450796 | 7.601418e-01 | 0 | 1 | 1 | 1 | 0.4999399 | 9.997430e-01 | 0 | 1 | 1 | 0 | 1 | 1 | 2 | 0.08160825 | 3.498268e-01 | 1 | 0.3077231 | 7.151241e-01 | 0 | 1 | 1 | 2 | 0.09019179 | 4.322399e-01 | 1 | 0.3375406 | 9.380489e-01 | 2 | 0.3447963 | 6.277908e-01 | 0 | 1 | 1 | 0 | 1 | 1 |
| ABC transporters | ko02010 | Environmental Information Processing | Membrane transport | 3 | 0.06543269 | 2.703728e-01 | 3 | 0.0344591 | 2.190614e-01 | 2 | 0.09172281 | 0.308701306 | 2 | 0.3370211 | 9.851618e-01 | 0 | 1 | 1 | 0 | 1 | 1 | 0 | 1 | 1 | 2 | 0.2798962 | 5.008669e-01 | 0 | 1 | 1 | 2 | 0.3326594 | 7.602019e-01 | 2 | 0.2270082 | 6.568130e-01 | 1 | 0.5239129 | 9.463171e-01 | 7 | 0.0002225436 | 4.037577e-03 | 5 | 0.003148774 | 2.894450e-02 | 6 | 0.07681174 | 2.129780e-01 | 0 | 1 | 1 | 0 | 1 | 1 |
| AGE-RAGE signaling pathway in diabetic complications | ko04933 | Human Diseases | Endocrine and metabolic diseases | 2 | 0.5923115 | 8.945946e-01 | 1 | 0.7868555 | 9.699723e-01 | 3 | 0.09409612 | 0.308701306 | 2 | 0.7276645 | 9.851618e-01 | 4 | 0.3638369 | 6.746749e-01 | 5 | 0.009495029 | 3.708436e-02 | 2 | 0.8783461 | 9.997430e-01 | 4 | 0.1812615 | 3.911442e-01 | 2 | 0.7680434 | 9.938591e-01 | 4 | 0.2445689 | 6.571154e-01 | 1 | 0.8571111 | 9.471165e-01 | 0 | 1 | 1 | 4 | 0.2779514 | 7.992310e-01 | 1 | 0.886803 | 9.983327e-01 | 14 | 0.004301094 | 2.475158e-02 | 2 | 0.2530578 | 0.4145695282 | 2 | 0.3961031 | 0.5706351898 |
| AMPK signaling pathway | ko04152 | Environmental Information Processing | Signal transduction | 7 | 0.01132116 | 1.077971e-01 | 1 | 0.8533535 | 9.941709e-01 | 2 | 0.3900536 | 0.645486931 | 9 | 0.004259939 | 6.191834e-02 | 4 | 0.5261921 | 8.027681e-01 | 3 | 0.217457 | 3.601088e-01 | 4 | 0.6532999 | 9.997430e-01 | 2 | 0.7659896 | 8.249119e-01 | 3 | 0.6702189 | 9.938591e-01 | 10 | 0.001108014 | 1.314306e-02 | 6 | 0.03149717 | 2.112163e-01 | 8 | 0.000685706 | 1.660932e-02 | 5 | 0.2367665 | 7.424530e-01 | 5 | 0.1268516 | 5.512279e-01 | 10 | 0.2678549 | 5.410314e-01 | 0 | 1 | 1 | 0 | 1 | 1 |
| Acute myeloid leukemia | ko05221 | Human Diseases | Cancers | 1 | 0.7495199 | 9.706835e-01 | 1 | 0.6550915 | 9.699723e-01 | 2 | 0.1715839 | 0.417343443 | 5 | 0.03068367 | 2.371011e-01 | 1 | 0.8830059 | 9.404372e-01 | 3 | 0.06010868 | 1.439150e-01 | 2 | 0.7131096 | 9.997430e-01 | 3 | 0.1967763 | 4.072414e-01 | 1 | 0.8561256 | 9.938591e-01 | 1 | 0.8293998 | 9.945835e-01 | 2 | 0.3822433 | 7.781381e-01 | 2 | 0.2931712 | 7.890287e-01 | 3 | 0.2800455 | 7.992310e-01 | 0 | 1 | 1 | 10 | 0.01165498 | 5.642490e-02 | 1 | 0.4910936 | 0.6560749266 | 4 | 0.01423769 | 0.0759299959 |
| Adherens junction | ko04520 | Cellular Processes | Cellular community - eukaryotes | 2 | 0.4253804 | 7.763192e-01 | 0 | 1 | 1 | 5 | 0.001118596 | 0.014941247 | 6 | 0.01043058 | 1.108249e-01 | 11 | 1.127976e-05 | 4.221853e-04 | 7 | 4.074162e-05 | 7.027929e-04 | 3 | 0.487982 | 9.997430e-01 | 5 | 0.02261862 | 1.055536e-01 | 2 | 0.6028198 | 9.938591e-01 | 3 | 0.279105 | 6.826972e-01 | 2 | 0.4093555 | 7.839524e-01 | 3 | 0.1055802 | 4.603297e-01 | 3 | 0.3093848 | 8.271973e-01 | 2 | 0.4659801 | 9.983327e-01 | 13 | 0.0006306894 | 5.829099e-03 | 7 | 5.978495e-06 | 0.0009924302 | 5 | 0.003063077 | 0.0284366062 |
| Adipocytokine signaling pathway | ko04920 | Organismal Systems | Endocrine system | 4 | 0.05158978 | 2.405319e-01 | 2 | 0.2948063 | 7.686886e-01 | 0 | 1 | 1 | 6 | 0.009148672 | 1.036289e-01 | 1 | 0.8900917 | 9.435683e-01 | 1 | 0.6060117 | 6.817632e-01 | 1 | 0.9256095 | 9.997430e-01 | 0 | 1 | 1 | 2 | 0.5876068 | 9.938591e-01 | 6 | 0.008732649 | 6.162755e-02 | 3 | 0.1546162 | 5.184190e-01 | 3 | 0.09916277 | 4.503642e-01 | 5 | 0.0407282 | 2.248905e-01 | 2 | 0.4516495 | 9.983327e-01 | 10 | 0.01412977 | 6.245768e-02 | 0 | 1 | 1 | 2 | 0.2515569 | 0.4541999583 |
| Adrenergic signaling in cardiomyocytes | ko04261 | Organismal Systems | Circulatory system | 2 | 0.7827878 | 9.706835e-01 | 2 | 0.6491116 | 9.699723e-01 | 3 | 0.2046917 | 0.446610143 | 3 | 0.7147816 | 9.851618e-01 | 8 | 0.07284742 | 2.848660e-01 | 5 | 0.03896706 | 1.052553e-01 | 5 | 0.5910894 | 9.997430e-01 | 5 | 0.2151012 | 4.338482e-01 | 2 | 0.9114716 | 9.938591e-01 | 4 | 0.4936209 | 8.673859e-01 | 3 | 0.5237373 | 8.212434e-01 | 2 | 0.6623462 | 9.463171e-01 | 3 | 0.7450128 | 9.968878e-01 | 2 | 0.8188733 | 9.983327e-01 | 9 | 0.5765319 | 8.333755e-01 | 3 | 0.1636511 | 0.3289492000 | 4 | 0.1326048 | 0.3237653250 |
| African trypanosomiasis | ko05143 | Human Diseases | Infectious diseases | 1 | 0.4834432 | 8.208427e-01 | 0 | 1 | 1 | 0 | 1 | 1 | 0 | 1 | 1 | 1 | 0.6407722 | 8.053797e-01 | 0 | 1 | 1 | 0 | 1 | 1 | 2 | 0.1655849 | 3.717850e-01 | 0 | 1 | 1 | 1 | 0.569936 | 9.322794e-01 | 0 | 1 | 1 | 0 | 1 | 1 | 0 | 1 | 1 | 1 | 0.5112305 | 9.983327e-01 | 2 | 0.6322935 | 8.421376e-01 | 2 | 0.04040078 | 0.1397193642 | 1 | 0.3642703 | 0.5424225687 |
| Alanine, aspartate and glutamate metabolism | ko00250 | Metabolism | Amino acid metabolism | 3 | 0.03365638 | 2.007375e-01 | 1 | 0.4254743 | 9.016003e-01 | 0 | 1 | 1 | 1 | 0.6054605 | 9.851618e-01 | 1 | 0.6727681 | 8.236694e-01 | 0 | 1 | 1 | 2 | 0.3709688 | 9.997430e-01 | 0 | 1 | 1 | 0 | 1 | 1 | 8 | 2.330427e-06 | 7.195193e-05 | 0 | 1 | 1 | 4 | 0.002270067 | 2.911027e-02 | 3 | 0.0704176 | 3.805547e-01 | 2 | 0.179702 | 6.607504e-01 | 2 | 0.6795209 | 8.730479e-01 | 0 | 1 | 1 | 0 | 1 | 1 |
| 基因集 | Pathway 富集结果 | Pathway 注释表 |
|---|---|---|
| Cluster_0 | Cluster_0.htm | Cluster_0.path.xls |
| Cluster_1 | Cluster_1.htm | Cluster_1.path.xls |
| Cluster_2 | Cluster_2.htm | Cluster_2.path.xls |
| Cluster_3 | Cluster_3.htm | Cluster_3.path.xls |
| Cluster_4 | Cluster_4.htm | Cluster_4.path.xls |
| Cluster_5 | Cluster_5.htm | Cluster_5.path.xls |
| Cluster_6 | Cluster_6.htm | Cluster_6.path.xls |
| Cluster_7 | Cluster_7.htm | Cluster_7.path.xls |
| Cluster_8 | Cluster_8.htm | Cluster_8.path.xls |
| Cluster_9 | Cluster_9.htm | Cluster_9.path.xls |
| Cluster_10 | Cluster_10.htm | Cluster_10.path.xls |
| Cluster_11 | Cluster_11.htm | Cluster_11.path.xls |
| Cluster_12 | Cluster_12.htm | Cluster_12.path.xls |
| Cluster_13 | Cluster_13.htm | Cluster_13.path.xls |
| Cluster_14 | Cluster_14.htm | Cluster_14.path.xls |
| Cluster_15 | Cluster_15.htm | Cluster_15.path.xls |
| Cluster_16 | Cluster_16.htm | Cluster_16.path.xls |
KO富集圈图:(第一圈:富集前20的pathway,圈外为基因数目的坐标尺。不同的颜色代表不同的A class; 第二圈:背景基因中该pathway的数目以及Q值。基因越多条形越长,Q值越小颜色越红; 第三圈:该pathway差异基因数量 第四圈:各pathway的RichFactor值(该pathway中差异数量除以所有数量),背景网格线,每一格代表0.1)
- Cluster_0 富集圈图
- Cluster_1 富集圈图
- Cluster_2 富集圈图
- Cluster_3 富集圈图
- Cluster_4 富集圈图
- Cluster_5 富集圈图
- Cluster_6 富集圈图
- Cluster_7 富集圈图
- Cluster_8 富集圈图
- Cluster_9 富集圈图
- Cluster_10 富集圈图
- Cluster_11 富集圈图
- Cluster_12 富集圈图
- Cluster_13 富集圈图
- Cluster_14 富集圈图
- Cluster_15 富集圈图
- Cluster_16 富集圈图
Fig 5-4-1 KO 富集圈图
KO富集气泡图:(利用Q值最小的前20个pathway来作图,纵坐标为pathway,横坐标为富集因子(该pathway中差异数量除以所有数量),大小表示数量多少,颜色越红Q值越小)");
- Cluster_0
- Cluster_1
- Cluster_2
- Cluster_3
- Cluster_4
- Cluster_5
- Cluster_6
- Cluster_7
- Cluster_8
- Cluster_9
- Cluster_10
- Cluster_11
- Cluster_12
- Cluster_13
- Cluster_14
- Cluster_15
- Cluster_16
Fig 5-4-2 KO富集气泡图
KO富集条形图:(利用Q值最小的前20个pathway来作图,纵坐标为pathway,横坐标为该pathway数目占所有差异数目的百分比,颜色越深Q值越小,柱子上的数值为该pathway数量及Q值");
- Cluster_0 富集柱形图
- Cluster_1 富集柱形图
- Cluster_2 富集柱形图
- Cluster_3 富集柱形图
- Cluster_4 富集柱形图
- Cluster_5 富集柱形图
- Cluster_6 富集柱形图
- Cluster_7 富集柱形图
- Cluster_8 富集柱形图
- Cluster_9 富集柱形图
- Cluster_10 富集柱形图
- Cluster_11 富集柱形图
- Cluster_12 富集柱形图
- Cluster_13 富集柱形图
- Cluster_14 富集柱形图
- Cluster_15 富集柱形图
- Cluster_16 富集柱形图
Fig 5-4-3 KO富集条形图
5.5 上调基因蛋白质互作网络分析
通过string数据库[10],我们可以获得上调基因构建蛋白质互作关系信息(3.MarkerGene/String),然后利用Cytoscape构建蛋白质互作网络图。
注:依据系统配置及浏览器不同,如果标记基因数量过多该图可能不能正常加载,请使用桌面版Cytoscape软件
Cytoscape官方手册:http://manual.cytoscape.org/en/stable/index.html
Cytoscape使用教程:http://www.omicshare.com/class/home/index/classdetail?id=14
6 GSVA分析
基于传统的超几何检验的富集分析,往往需要用到显著差异基因集数据。当单个基因变化较为微弱时,基于传统富集分析得到结果可能会很少,甚至没有结果。GSVA分析(Gene Set Variation Analysis)[11]能够有效弥补传统富集分析对微效基因的有效信息挖据不足等问题,更为全面地对某一功能单位的调节作用进行解释。GSVA分析反映了某一个细胞亚群相对于所有细胞过表达的通路信息。GSVA原理如下:
- 将每个基因在所有cluster的表达量分布情况进行统计,然后将基因在每个样本中按照表达量从高到低进行排序
- 分析特定基因集是否在所有基因中的排名更为靠前或靠后,然后对基因集在每个样本中的富集程度进行打分,即富集分数(Enrichment Score, ES)
我们对MSigDB数据库的八个数据集的每个通路进行GSVA分析
MSigDB数据库各数据集在各细胞富集程度表:
- H: 4.GSVA/H.gsva.xls
- C1: 4.GSVA/C1.gsva.xls
- C2: 4.GSVA/C2.gsva.xls
- C3: 4.GSVA/C3.gsva.xls
- C4: 4.GSVA/C4.gsva.xls
- C5: 4.GSVA/C5.gsva.xls
- C6: 4.GSVA/C6.gsva.xls
- C7: 4.GSVA/C7.gsva.xls
- H
- C1
- C2
- C3
- C4
- C5
- C6
- C7
Fig 6-0-1 各个亚群中的富集分数热图
7 细胞周期分析
7.1 细胞周期评估
常规样本中,仅干细胞、祖细胞、癌细胞等具备增殖分化潜力的细胞才具有细胞分裂的能力,即处于细胞周期中。我们通过周期蛋白在细胞中的表达情况对细胞所处的细胞周期进行评分,以此直观体现各个样本中的细胞分裂/增殖活性。
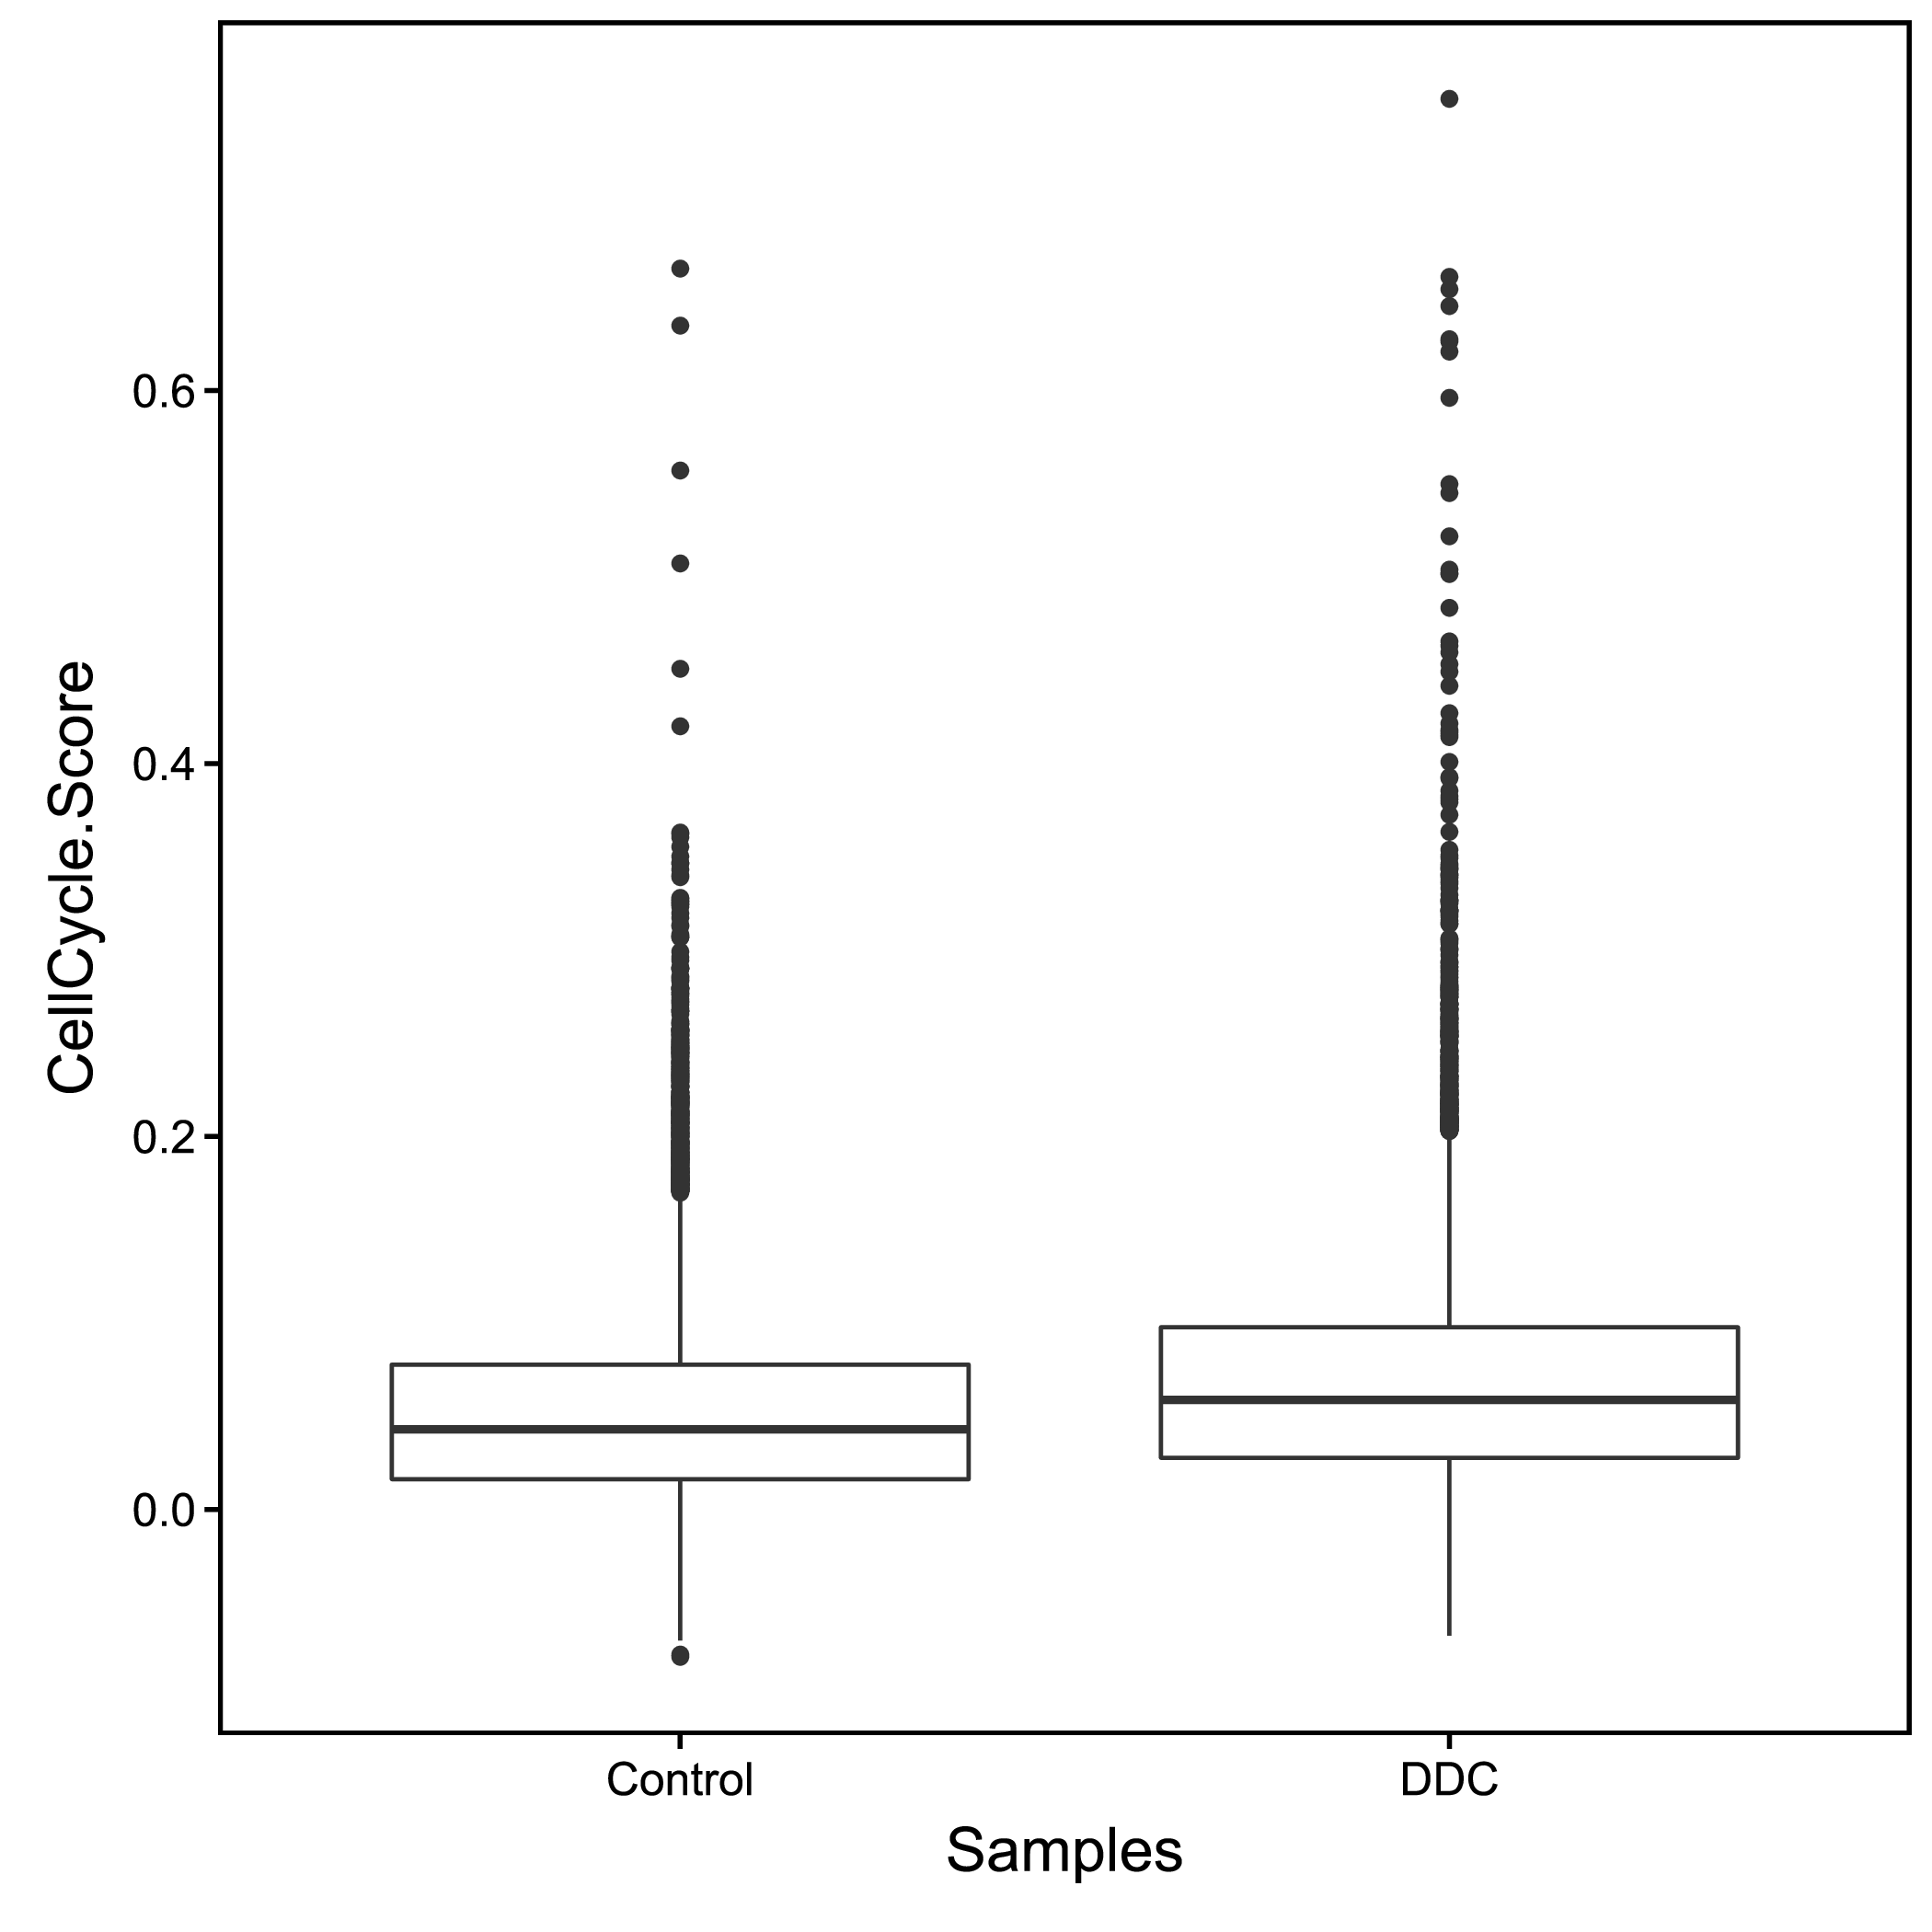 |
| Fig 7-1-1 不同样本的细胞周期指数评估 |
7.2 细胞周期推断
每一个细胞周期都有特征表达的周期蛋白,通过每个细胞周期的特征周期蛋白[21],我们可以对细胞的各个细胞周期进行评分,通过评分,我们可以推测细胞所处的细胞周期:
- 我们可以推测细胞所处的细胞周期细胞在所有细胞周期中的评分均<0,则认为细胞不处于细胞周期中
- 细胞获得最高分值所对应的细胞周期被认为是细胞所处细胞周期
| Cells | Samples | Clusters | G1 | S | G2 | M | CellCycle.Score | Phase |
|---|---|---|---|---|---|---|---|---|
| Control_AAACCCAAGAAGTATC | Control | 3 | -0.0587845964814063 | -0.0154632076371087 | -0.0169571564744789 | -0.0281281203767242 | -0.0154632076371087 | non-cycling |
| Control_AAACCCAAGAGGGCGA | Control | 1 | -0.00860483687417736 | -0.0322890945327648 | -0.0308494228933196 | -0.108124598212906 | -0.00860483687417736 | non-cycling |
| Control_AAACCCAAGCCATTGT | Control | 3 | -0.0120942911292959 | 0.035584219280841 | 0.0498732573098604 | -0.0136014621433962 | 0.0498732573098604 | G2 |
| Control_AAACCCAAGTGCTCAT | Control | 4 | -0.136221876399368 | -0.00660768728117632 | -0.0121575619226615 | -0.00655686501751004 | -0.00655686501751004 | non-cycling |
| Control_AAACCCACACATTACG | Control | 0 | -0.0374302131599929 | 0.0545819253134413 | 0.0276070181394694 | -0.0333166212804191 | 0.0545819253134413 | S |
| Control_AAACCCACACTCACTC | Control | 3 | -0.0475700185733527 | 0.0281975610263254 | -0.00396083843592764 | 0.00010239325757791 | 0.0281975610263254 | S |
| Control_AAACCCAGTATAGCTC | Control | 11 | -0.0243249522713944 | -0.0198546033798266 | -0.0347175913410563 | 0.00495352432400906 | 0.00495352432400906 | M |
| Control_AAACCCAGTCATGACT | Control | 10 | -0.0969536176476925 | -0.0227771043087296 | 0.000184471258750277 | -0.0210556442743421 | 0.000184471258750277 | G2 |
| Control_AAACCCAGTCCGGCAT | Control | 3 | -0.161162588698223 | -0.0539907637980259 | -0.0460324682277105 | -0.0475894211147426 | -0.0460324682277105 | non-cycling |
| Control_AAACCCAGTCTACTGA | Control | 4 | 0.020175419621808 | 0.022367689776545 | 0.00273748406828021 | -0.0234567040740592 | 0.022367689776545 | S |
| Control_AAACCCAGTGGTTCTA | Control | 1 | -0.13456935584646 | 0.155223397578583 | 0.0240005500574801 | -0.0100605193579502 | 0.155223397578583 | S |
| Control_AAACCCAGTGTCCTAA | Control | 6 | -0.112093675502773 | 0.0199814692626372 | -0.0202568189255216 | -0.104812321054437 | 0.0199814692626372 | S |
| Control_AAACCCATCACCACAA | Control | 0 | 0.0973202952167085 | -0.0329430011684585 | 0.0262933603116692 | -0.024526124561154 | 0.0973202952167085 | G1 |
| Control_AAACCCATCCTCTCGA | Control | 3 | -0.0815857574148671 | 0.0399115765832385 | -0.0164252360976582 | -0.0165488633453253 | 0.0399115765832385 | S |
| Control_AAACCCATCGAAATCC | Control | 4 | -0.127776325662323 | 0.0687253713588798 | -0.00470390901353283 | -0.0230473318303113 | 0.0687253713588798 | S |
| Control_AAACGAAAGATTGAGT | Control | 0 | 0.00662842174196435 | -0.0391323625825285 | -0.0528332388410231 | -0.0814456664109839 | 0.00662842174196435 | G1 |
| Control_AAACGAAAGGCTAACG | Control | 4 | -0.0341706093177366 | -0.0371504014711734 | -0.0433618635768944 | 0.0373540907121824 | 0.0373540907121824 | M |
| Control_AAACGAACACCTATCC | Control | 1 | 0.0159118755454719 | -0.042606472549617 | -0.0402880100639022 | -0.0553125822183627 | 0.0159118755454719 | G1 |
| Control_AAACGAACATGAAGGC | Control | 6 | -0.0284494260429285 | -0.0645155882932661 | 0.0108237958929478 | -0.000395645117383464 | 0.0108237958929478 | G2 |
| Control_AAACGAACATGTAACC | Control | 3 | -0.0222209279500079 | -0.102890110356942 | 0.0141419305810994 | 0.00998573830194721 | 0.0141419305810994 | G2 |
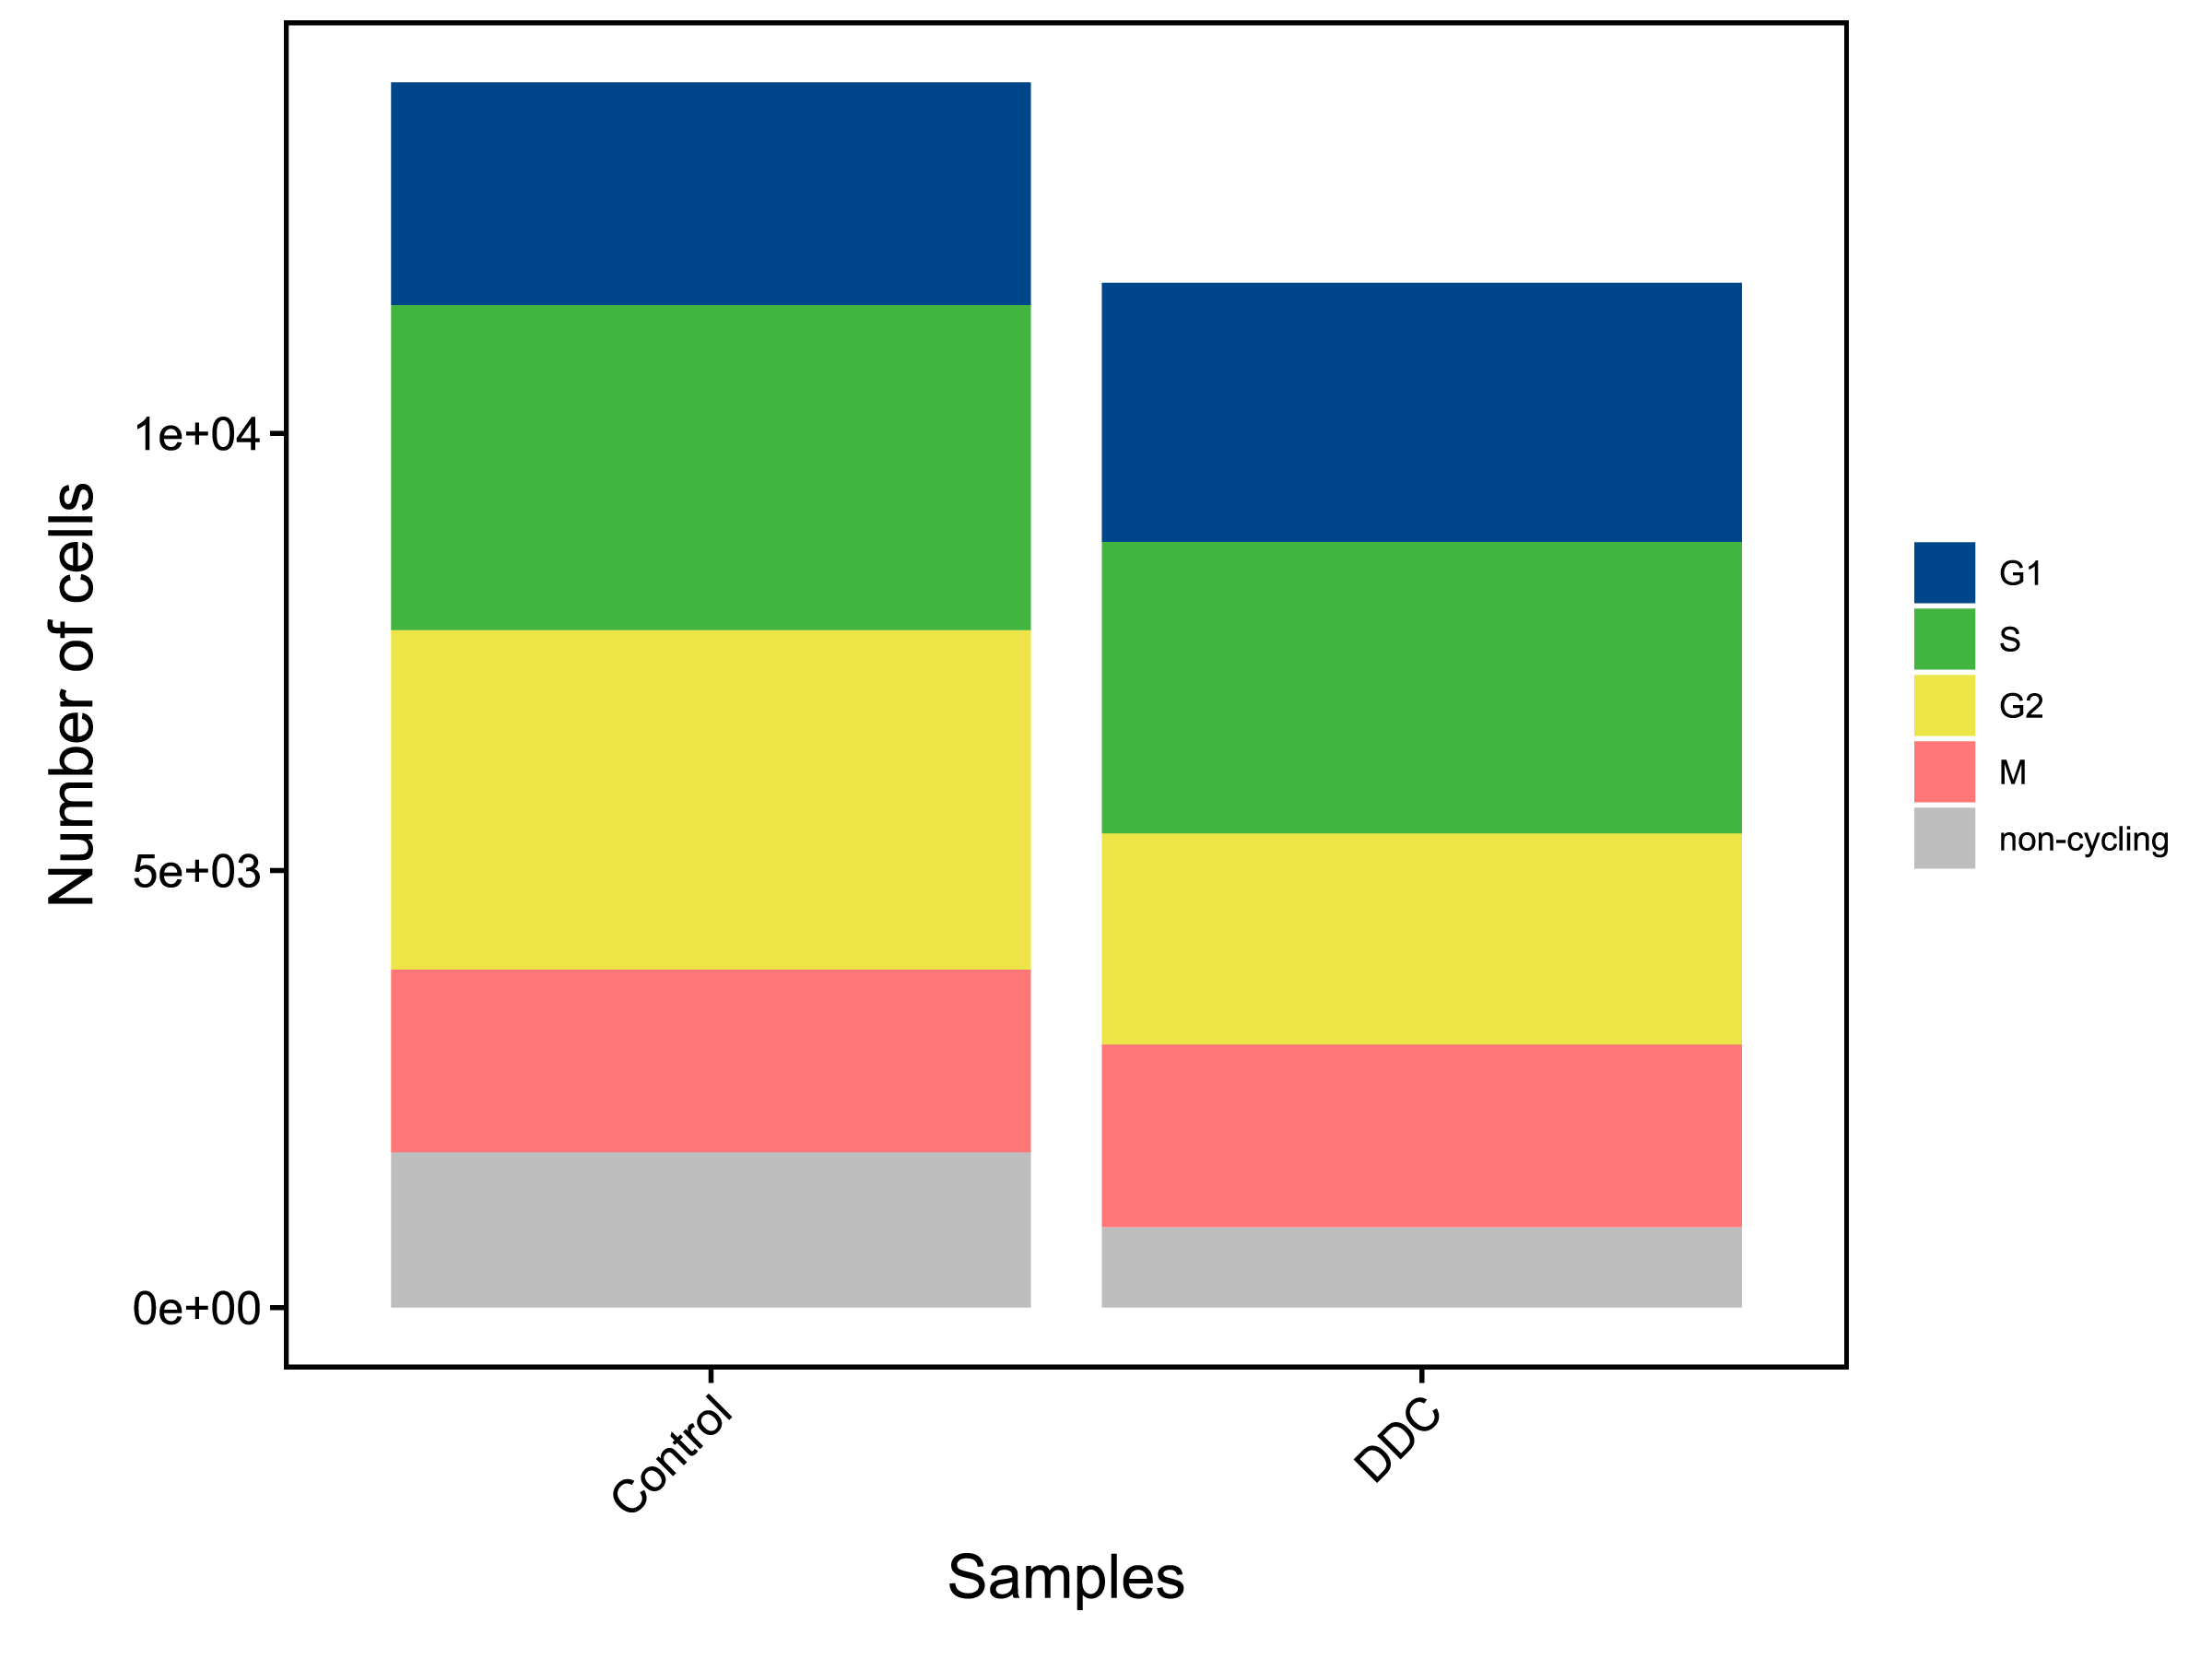 |
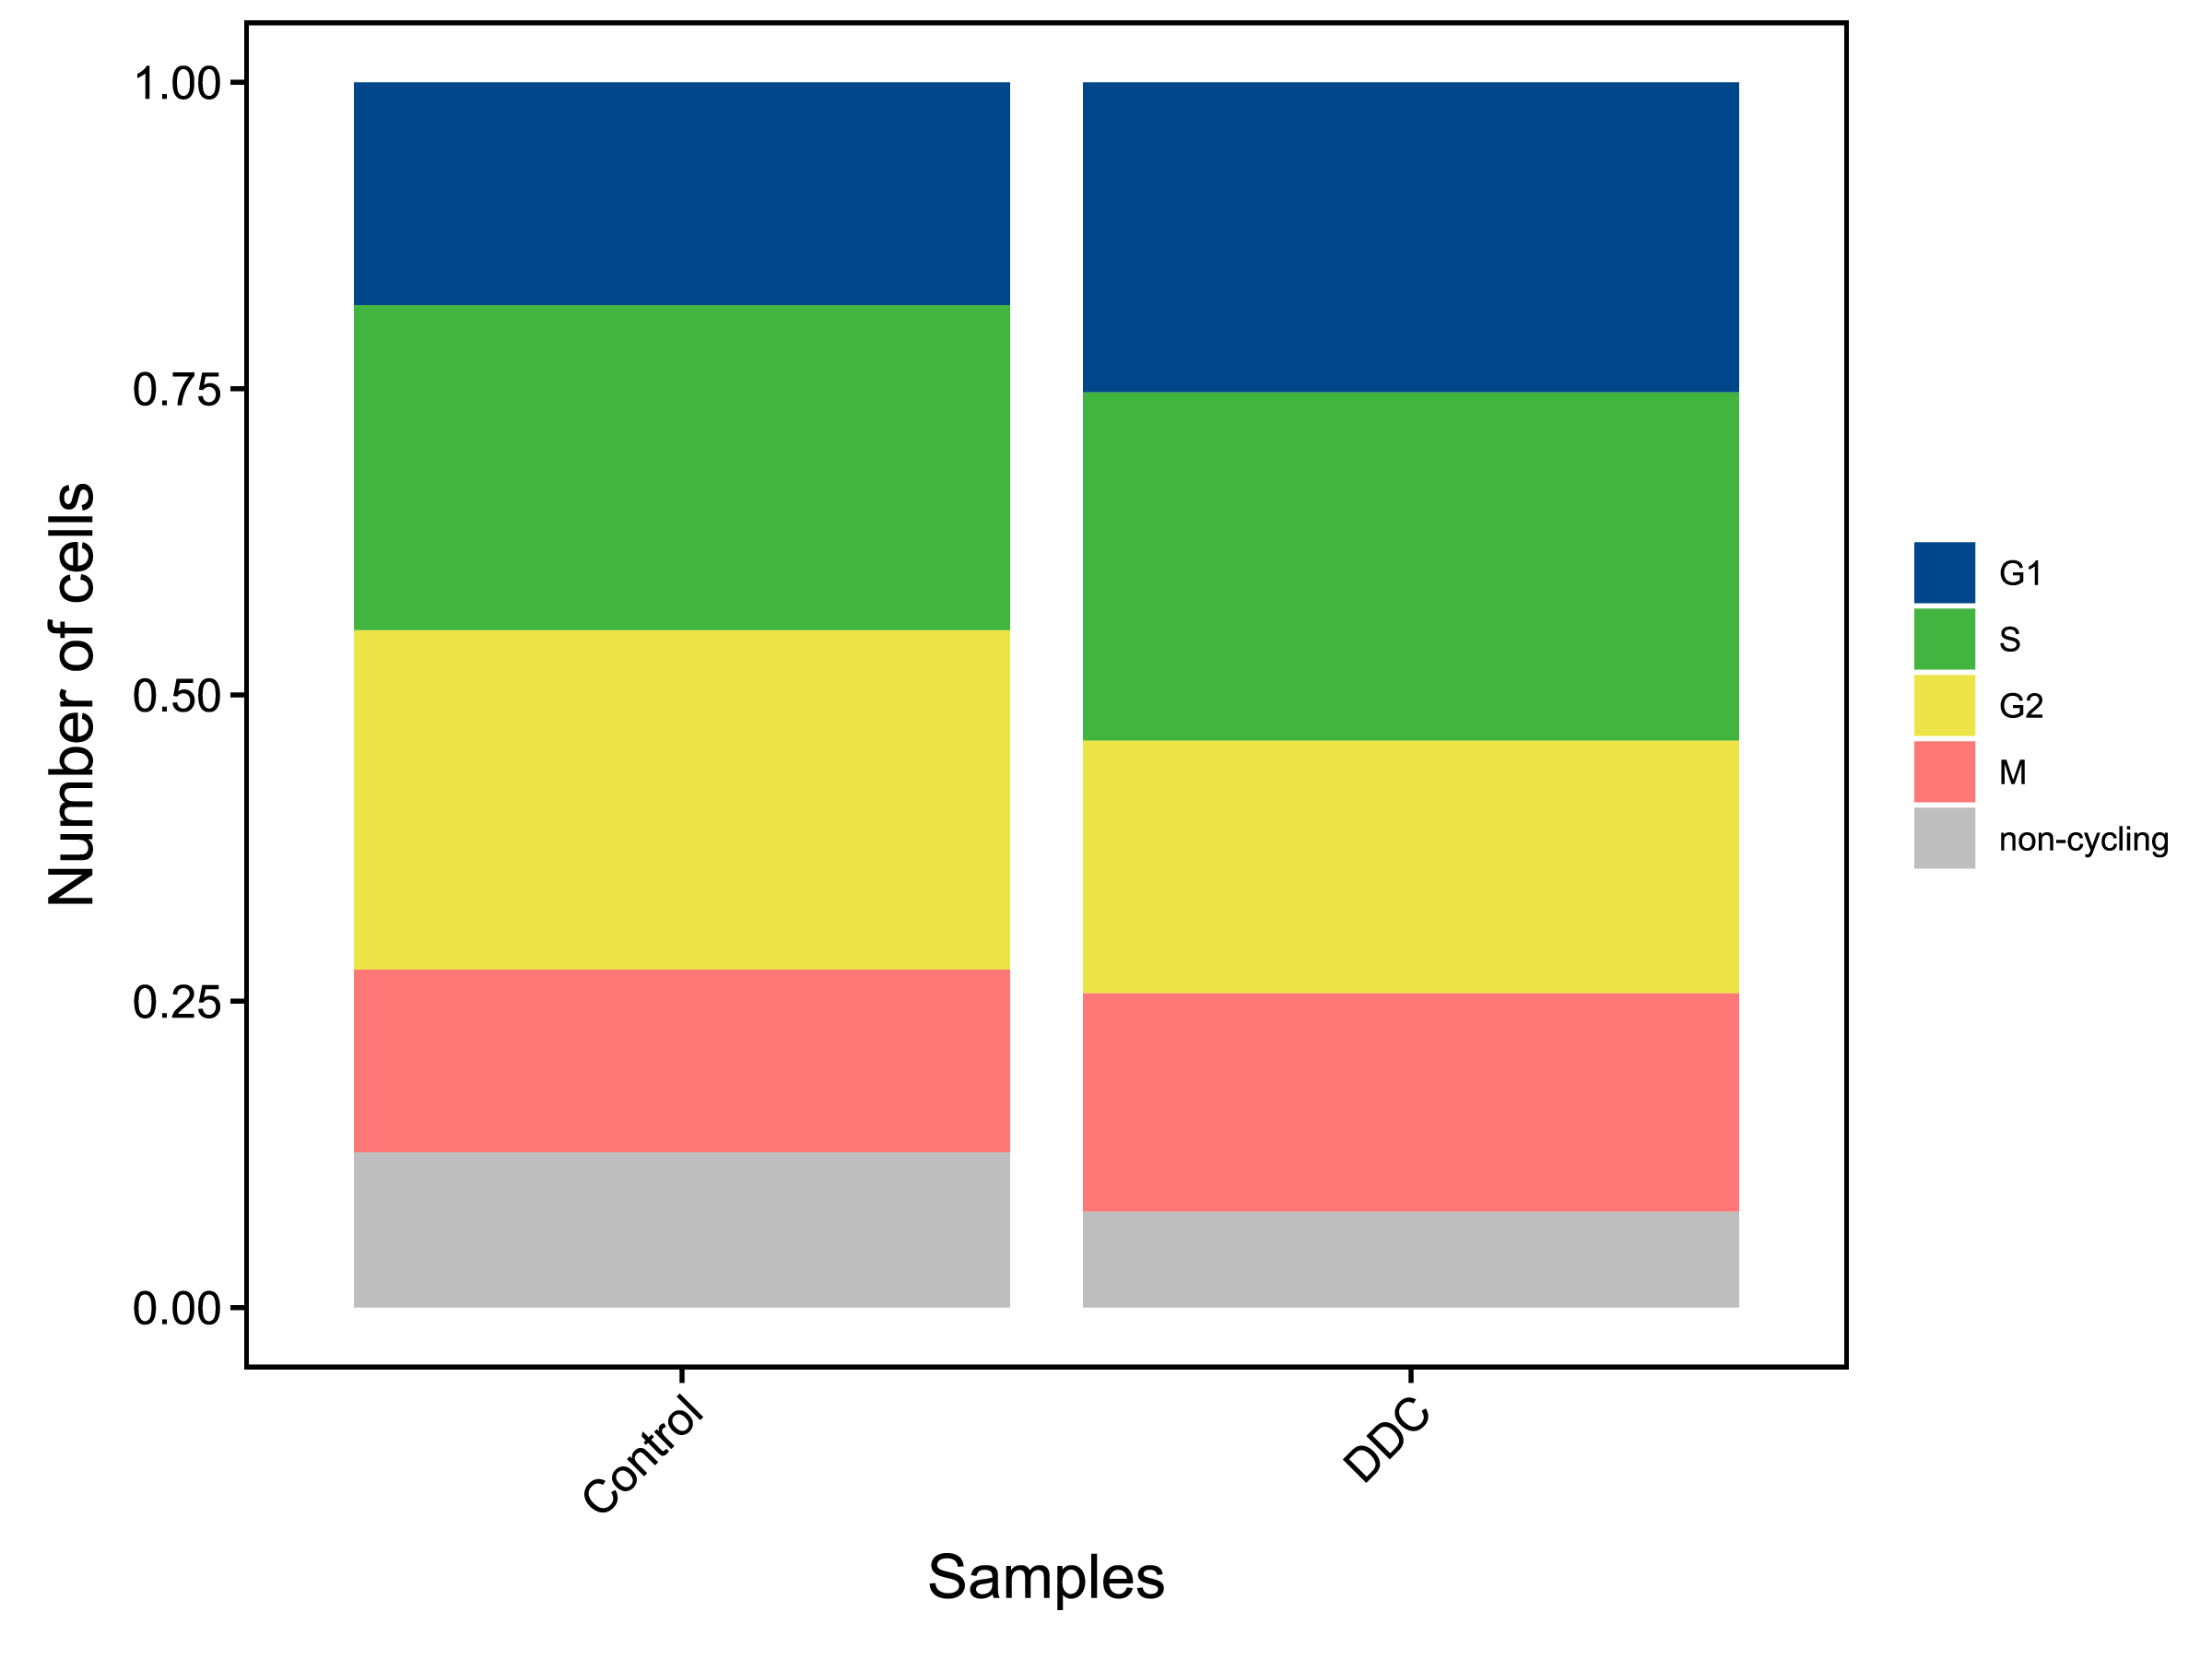 |
|
| Fig 7-2-1 不同样本的不同细胞周期细胞的数量堆叠图 | Fig 7-2-2 不同样本的不同细胞周期细胞的数量比例堆叠图 | |
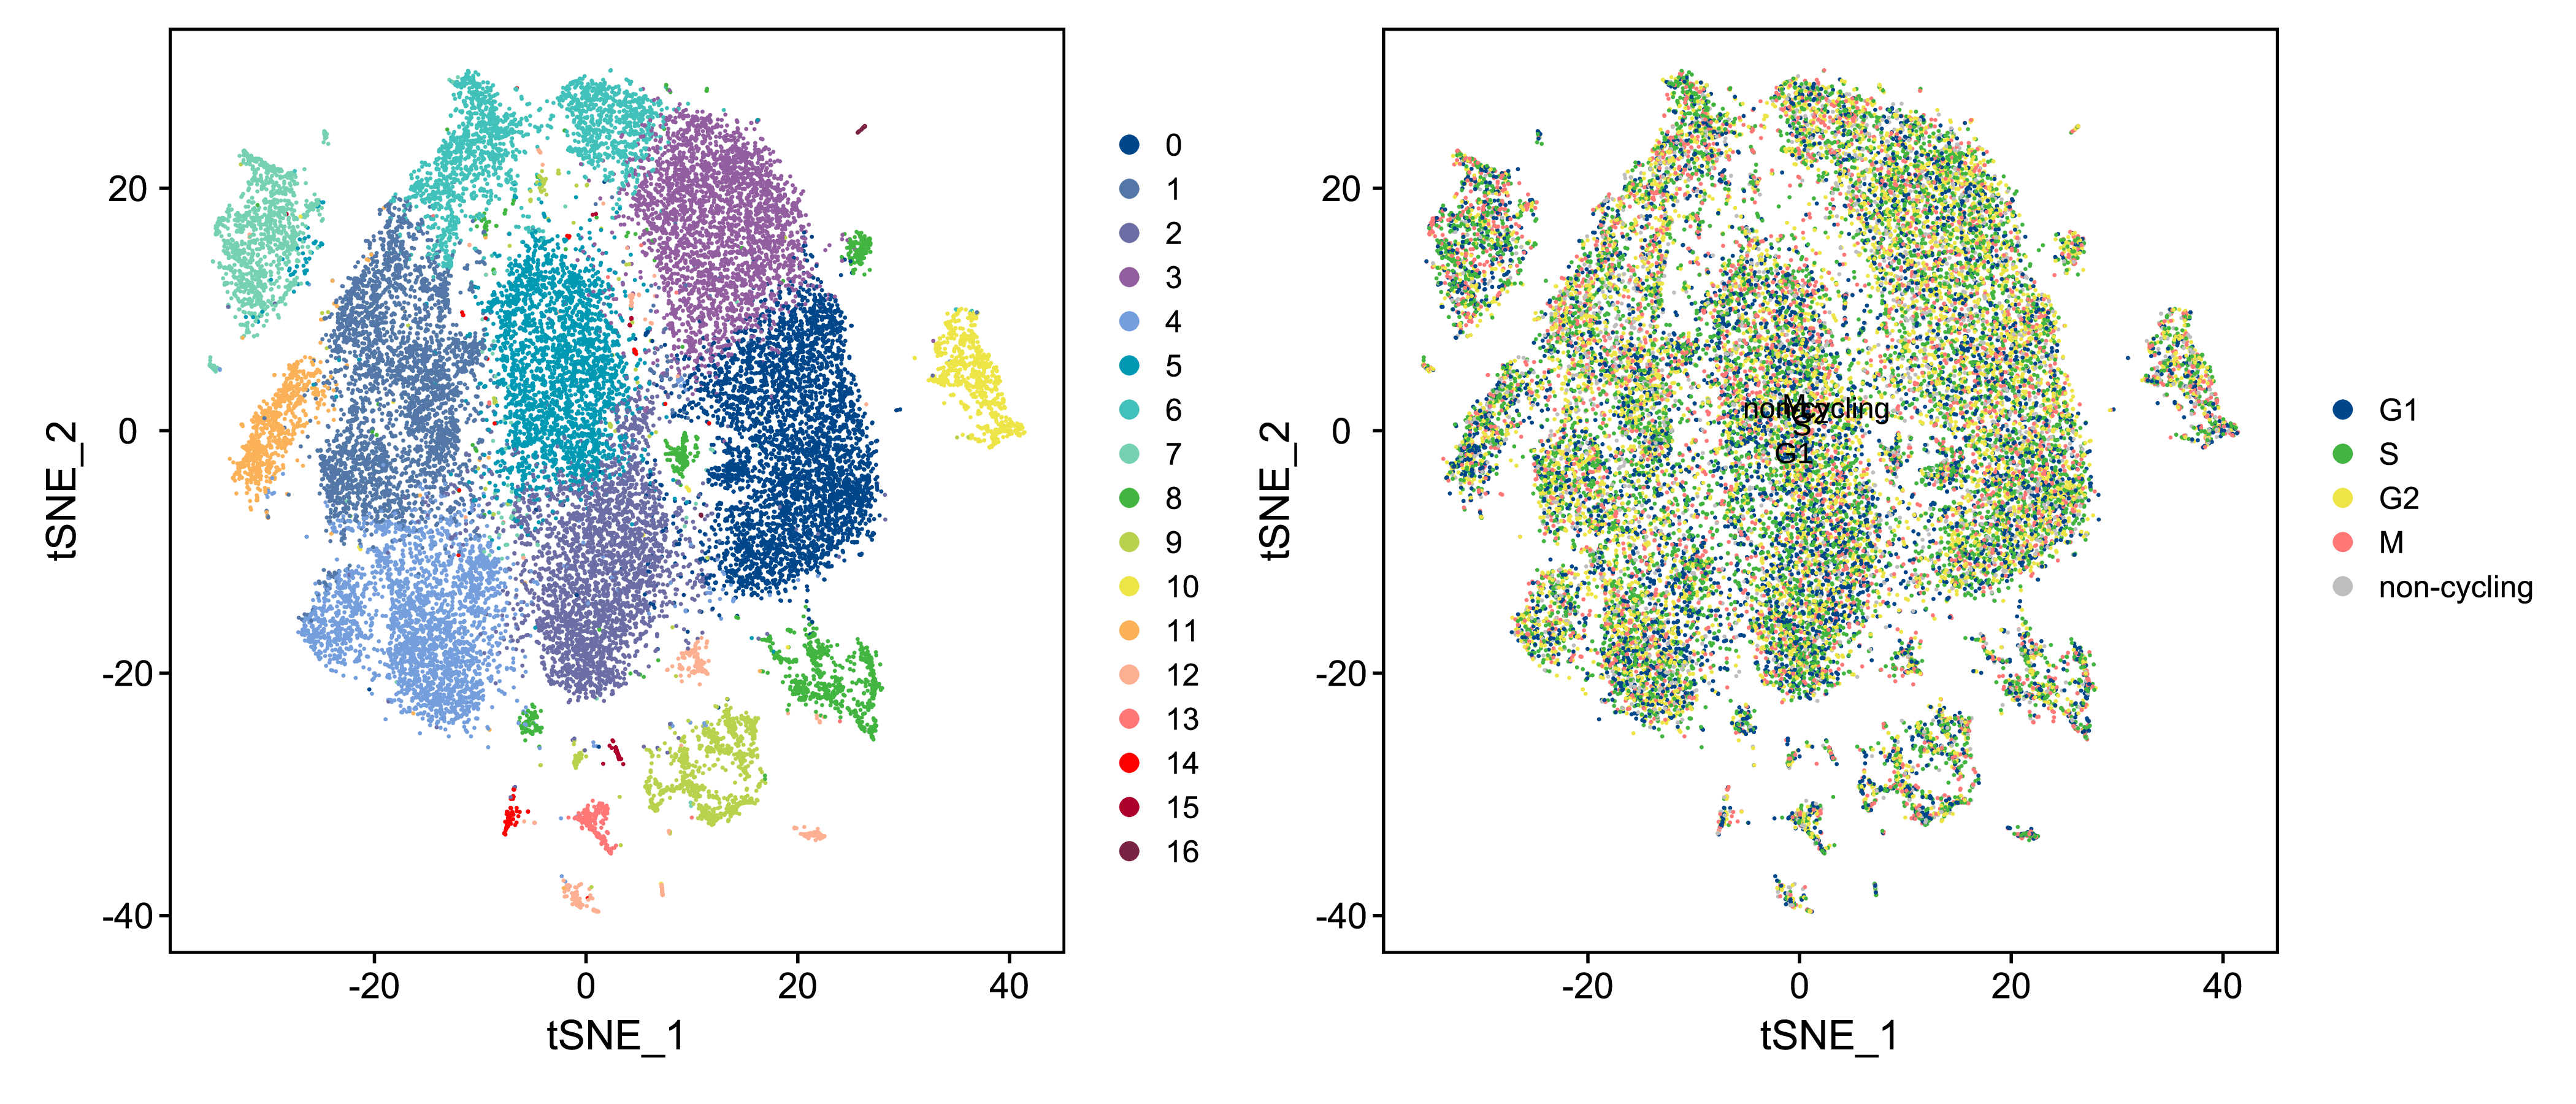 |
| Fig 7-2-3 不同细胞周期细胞的tSNE分布 |
 |
| Fig 7-2-4 Seurat分群与细胞周期推断对应circos图 |
7.3 周期蛋白基因分布可视化
细胞周期推断是基于每个细胞周期的特征周期蛋白基因在细胞中的表达量,利用软件预测的结果。那么我们就可以通过观察细胞周期特征基因的表达分布,对预测结果进行初步验证,这个过程即为周期蛋白基因分布可视化。
周期蛋白基因:CellCycle.genes.xls
| G1 | S | G2 | M |
|---|---|---|---|
| Ccne1 | Abcc5 | Arl4a | Ahi1 |
| Ccne2 | Asf1b | Aurkb | Akirin2 |
| Cdc25a | Atad2 | Brd8 | Anln |
| Cdca7 | Brca1 | Bub3 | Anp32e |
| Dtl | Cdkn2aip | Casp3 | Arl6ip1 |
| Ints8 | Cenpq | Ccdc107 | Asxl1 |
| Ivns1abp | Crebzf | Ccna2 | Aurka |
| Mcm2 | Donson | Ccnf | Birc2 |
| Mcm6 | Dscc1 | Cdc25c | Birc5 |
| Nasp | E2f8 | Cdca2 | Bub1 |
| Plcxd1 | Exo1 | Cdca3 | Ccnb2 |
| Skp2 | Ezh2 | Cdca8 | Cdc20 |
| Slbp | Fen1 | Cdk1 | Cdc25b |
| Ung | Hells | Cdkn1b | Cdc27 |
| Zranb2 | Mastl | Cdkn2c | Cenpa |
| - | Pkmyt1 | Cenpl | Cenpe |
| - | Rbbp8 | Ckap2 | Cenpf |
| - | Rfc2 | Ckap2l | Cep55 |
| - | Rrm2 | Dcaf7 | Cit |
| - | Usp1 | Espl1 | Ckap5 |
热图可以同时展示大量基因在每个细胞中的表达量及其在细胞群体中的分布情况。使用热图展示周期蛋白基因在不同细胞周期的表达量,可以看到各时期特征蛋白基因相对集中表达在对应的时期中,是对细胞周期推断结果准确性的验证。
 |
| Fig 7-3-1 周期蛋白基因在不同细胞周期的表达量热图 |
8 个性化分析推荐
8.1 细胞亚群鉴定
细胞亚群鉴定是进行单细胞转录组分析的最基础一步,是赋予细胞数据以生物学意义的关键过程。细胞亚群鉴定主要借助marker基因在各个细胞亚群的表达情况来判断细胞亚群所属细胞类型。按照marker基因的查询方式,我们通常会遇到三种情况:
(1)人、小鼠常见组织的细胞类型注释。如今已经建立了许多数据库用以收集marker基因信息,例如Cell Marker(人、小鼠,http://bio-bigdata.hrbmu.edu.cn/CellMarker/),panglaoDB(人、小鼠,https://panglaodb.se/),MCA(小鼠,http://bis.zju.edu.cn/MCA/)。根据数据库内容,我们可以快速锁定组织类型和细胞类型,并获取相关的marker基因。
(2)人、小鼠罕见组织、稀有细胞类型及其他模式物种的细胞类型注释。这一类细胞通常没有成型的数据库可以快速查询。此时,我们需要从已有的单细胞文章、细胞生物学文章和分子生物学文章找寻相关细胞类型的marker基因。在找寻marker基因时,优先考虑荧光定量PCR(qPCR)和RNA荧光原位杂交(FISH)的结果,因为这些技术直接体现mRNA的表达水平,更容易在scRNA-seq数据中找到表达量分布情况;次级考虑蛋白免疫印迹(western blot)、流式细胞术(FAC)和免疫荧光(IF)的结果,因为蛋白水平和mRNA水平并不是完全同步的,可能出现蛋白高丰度但是mRNA低丰度的情况,使得scRNA-seq不具有相应marker基因的表达分布。
(3)人和模式物种的新细胞类型及非模式物种的细胞类型注释。这一类细胞通常缺乏前人的研究基础,无可直接利用的marker基因。为了完成细胞亚群注释,我们可以使用同源比对的方式将基因比对到具有marker基因信息的近缘物种上,然后使用同源比对得到的marker基因用于注释细胞亚群。当然,细胞类型最终是与细胞功能相关的,我们也可以通过细胞亚群上调基因的功能注释或富集的功能通路来确定细胞功能,并结合生物学背景推测细胞亚群所属的细胞类型。
8.2 拟时分析
细胞分化相关分析一直是研究人员广泛关注的问题,其与胚胎发育、组织修复、疾病发生等多个研究领域紧密相关。单细胞转录组的特征是获得了大量细胞的转录本“快照”,记录了样本中所有细胞的转录本,其中包含了多功能性较强的干细胞、过渡阶段的中间细胞和发育成熟的功能细胞,这为细胞分化相关分析提供了基础。
拟时分析通过分析关键基因的表达模式,将所有细胞按照发育时间的先后排布在拟时间轴上,模拟发育过程中的细胞分化过程。通过对细胞轨迹的分析,我们可以挖掘出细胞分化过程中经历的细胞类型变化、伴随发育过程变化的动态变化基因、祖细胞不同的分化命运等与生命发育息息相关的信息。
8.3 细胞周期分析
胚胎干细胞、肿瘤细胞、生殖细胞、植物根尖、芽尖等细胞除了具备多功能性的分化能力以外,还需具备自我增殖能力。而在增殖过程中,细胞进程必然涉及细胞周期。
细胞周期分析必然在细胞鉴定之后,对具有增殖能力的细胞进行细胞周期分析才具有切实的生物学意义。通过早期的细胞周期研究,我们已知了若干与细胞周期各个时期相关的周期蛋白基因,通过这些基因的表达情况,我们可以进一步推测细胞所处细胞周期。
对细胞周期的分析,既可以深入探索与细胞周期进行有关的新的标记基因,也可以侧面反映样本的细胞更新活性,对样本的表型做出关联解释。
细胞周期分析目前只能分析人和小鼠,其他物种可以同源比对,但存在一定误差。
8.4 WGCNA
单细胞转录组数据的特点是数据庞大,同一个细胞通常带有细胞类型、样本属性、表型特征等多级注释信息,导致单细胞转录组分析时可以进行比较方式多样而繁复。极高的复杂程度需求有效的简化方式。
权重基因共表达网络分析(weighted gene co-expression network analysis, WGCNA)可以将大量的基因简化成少量的具有相同表达模式的模块,并进一步找到与表型相关性最高的基因模块。这一分析极大得简化了数据挖掘过程,有利于从具有复杂样本设计和细胞组成的样本中快速锁定核心基因。
8.5 转录因子分析
转录因子是重要的基因调控元件,在外界刺激中,表达量一般优先发生变化,并进一步调控下游基因的表达完成对刺激的响应。所以,转录因子与靶基因之间具备潜在的共表达关系。
借助这一个基础,我们可以使用软件SCENIC将转录因子和靶基因构建为一个网络单位,通过对网络单位的表达活性的分析来研究不同细胞类型之间的转录调控差异。这种差异同时体现在转录因子的表达情况和转录因子的功能特性(靶基因的表达情况)上,对细胞的表型变化会有更加全面的解释度。
目前转录因子分析只能做人、小鼠和果蝇,其他物种的分析流程待开发。
8.6 细胞通讯分析
多细胞生命体的正常运转离不开多种细胞类型之间的有序合作,生命体的表型变化也不应该是由单一细胞类型的功能决定的。所以,为了获得更具有解释力的分子机制,我们往往需要从细胞间的分子信号交互去解释表型变化。
细胞通讯分析从细胞的配体-受体表达情况去推测细胞类型之间的互作关系。这些互作关系体现了下游细胞的激活、细胞信号转导和靶向细胞的杀伤,在宿主免疫、肿瘤微环境等领域都有广泛的应用前景。
目前细胞通讯分析理论上只能做人的,小鼠基因可以比对到人数据库进行参考分析,其他物种需要提供配受体信息数据库才能进行。
9 目录结构
结果文件夹
├── 1.Expression                                            定量结果文件夹
│   ├── barcode_plot                                            有效细胞鉴定图文件夹
│   │   └── *.barcode_plot.{pdf,png}                                有效细胞鉴定图
│   ├── CellRanger_Report                                       Cell Ranger报告文件夹
│   │   └── CellRanger.*.result.html                                Cell Ranger count结果报告
│   ├── expressions                                             表达量结果文件夹
│   │   ├── *                                                       各样本结果文件夹
│   │   │   ├── expression.xls                                          表达量矩阵表
│   │   │   ├── barcodes.tsv                                            细胞barcode ID表
│   │   │   ├── genes.tsv                                               基因ID与名称表
│   │   │   └── matrix.mtx                                              表达量稀疏矩阵
│   │   └── *.expression.demo.xls                                   表达量矩阵示例表
│   ├── samples.align.stat.xls                                  各样本比对结果统计表
│   └── samples.sequence.stat.xls                               各样本测序数据统计表
├── 2.Cluster                                               聚类结果文件夹
│   ├── 1.QC                                                    质控结果文件夹
│   │   ├── AfterFilter.BasicInfo.merge.{pdf,png}                   过滤后各个样本细胞基本信息的分布图
│   │   ├── AfterFilter.BasicInfo.nUMI-nGene.{pdf,png}              过滤后各个样本细胞基本信息的分布散点图
│   │   ├── AfterFilter.BasicInfo.nUMI-pMito.{pdf,png}              过滤后各个样本细胞基本信息的分布散点图
│   │   ├── AfterFilter.BasicInfo.PresetMarker.{pdf,png}            过滤后各个样本细胞中预设标记基因的表达量分布
│   │   ├── BasicInfo.merge.{pdf,png}                               过滤前各个样本细胞基本信息的分布图
│   │   ├── BasicInfo.nUMI-nGene.{pdf,png}                          过滤前各个样本细胞基本信息的分布散点图
│   │   ├── BasicInfo.nUMI-pMito.{pdf,png}                          过滤前各个样本细胞基本信息的分布散点图
│   │   ├── BasicInfo.PresetMarker.{pdf,png}                        过滤前各个样本细胞中预设标记基因的表达量分布
│   │   └── Filter.stat.xls                                         过滤前后各个样本中细胞数据量统计表
│   ├── 2.cluster                                               分群结果文件夹
│   │   ├── AllGene.avg_exp.annot.xls                               基因在各个亚群中表达量的均值表
│   │   ├── Cells.cluster.list.xls                                  细胞与亚群对照表
│   │   ├── tSNE_*.{pdf,png}                                        各样本单细胞亚群分类tSNE图
│   │   └── tSNE.{pdf,png}                                          单细胞亚群分类tSNE图
│   ├── 3.cluster_stat                                          分群结果的统计结果文件夹
│   │   ├── Cluster.stat.inSamples.pct.{pdf,png}                    各亚群中各个样本细胞数量百分比堆叠图
│   │   ├── Cluster.stat.inSamples.{pdf,png}                        各亚群中各个样本细胞数量堆叠图
│   │   ├── Cluster.stat.bySamples.pct.{pdf,png}                    各样本中各亚群细胞数量百分比堆叠图
│   │   ├── Cluster.stat.bySamples.{pdf,png}                        各样本中各亚群细胞数量堆叠图
│   │   ├── Cluster.stat.Sample.xls                                 各样本中各亚群细胞数量统计表
│   │   ├── Cluster.stat.xls                                        细胞亚群分类结果统计表
│   │   ├── Cluster.cor.heatmap.{pdf,png}                           各亚群相关性系数热图
│   │   ├── PresetMarker.Distribution.{pdf,png}                     已知标记基因在各个细胞亚群中的表达分布
│   │   ├── PresetMarker.DotPlot.{pdf,png}                          已知标记基因在各个细胞亚群中的表达分布气泡图
│   │   ├── PresetMarker.Heatmap.{pdf,png}                          已知标记基因在各个亚群的表达量热图
│   │   └── PresetMarker.VlnPlot.{pdf,png}                          已知标记基因在各个细胞亚群中的表达分布小提琴图
│   └── 4.CellAnnotation                                        单细胞亚群鉴定结果文件夹
│       ├── Cell.annotation.stat.xls                                各样本在各个细胞类型中细胞数量统计表
│       ├── Cells.annotation.circos.{pdf,png}                       Seurat分群与singleR细胞鉴定对应circos图
│       ├── Cells.annotation.{pdf,png}                              各细胞类型在tSNE图的分布
│       ├── Cluster.correlation.heatmap.{pdf,png}                   Seurat分群与singleR鉴定细胞类型相关性热图
│       ├── Cluster.sample.singleR.stat.pct.{pdf,png}               各细胞类型中各样本细胞数量百分比堆叠图
│       ├── Cluster.sample.singleR.stat.{pdf,png}                   各细胞类型中各样本细胞数量堆叠图
│       ├── Cluster.stat.sample.singleR.xls                         各样本在各个细胞类型中细胞数量统计表
│       ├── Sample.cluster.singleR.stat.pct.{pdf,png}               各样本中各细胞类型数量百分比堆叠图
│       └── Sample.cluster.singleR.stat.{pdf,png}                   各样本中各细胞类型数量堆叠图
├── 3.MarkerGene                                            亚群上调表达基因分析结果文件夹
│   ├── DeGene.list.xls                                         各亚群差异基因注释表
│   ├── DeGene.stat.{pdf,png}                                   各亚群上调基因数量统计柱状图
│   ├── DeGene.stat.xls                                         各亚群上调基因数量统计表
│   ├── Enrichment                                              上调表达基因富集分析结果文件夹
│   │   ├── GO                                                      GO功能富集分析结果文件夹
│   │   ├── KO                                                      KO功能富集分析结果文件夹
│   │   ├── DO                                                      DO功能富集分析结果文件夹
│   │   └── Reactome                                                Reactome功能富集分析结果文件夹
│   ├── Plots                                                   上调基因表达分布结果文件夹
│   │   ├── Top.DotPlot.{pdf,png}                                   标记基因表达分布气泡图
│   │   ├── Top.Heatmap.{pdf,png}                                   标记基因表达热图
│   │   ├── ExpPlot                                                 标记基因表达分布图文件夹
│   │   ├── DensityPlot                                             标记基因表达分布密度图文件夹
│   │   └── ViolinPlot                                              标记基因表达分布小提琴图文件夹
│   └── String                                                  蛋白质互作网络分析结果文件夹
│       ├── Top.aln.links.xls                                       标记基因与String蛋白对应表及析构关系表
│       ├── Top.edge.tsv                                            Cytoscape绘图文件--连接信息文件
│       └── Top.node.tsv                                            Cytoscape绘图文件--节点信息文件
├── 4.GSVA                                                  GSVA分析
│   ├── *.gsva.xls                                              各细胞富集程度表
│   └── *.heatmap.cluster.{xls,pdf,png}                         各个亚群中的富集分数热图
├── 5.TF                                                    转录因子注释结果文件夹
│   └── TF.annot.xls                                            转录因子注释表
├── 6.CellCycle                                             细胞周期分析
│   ├── CellCycle.annot.xls                                     各细胞的细胞周期表
│   ├── CellCycle.boxplot.{pdf,png}                             不同样本的细胞周期指数评估盒形图
│   ├── CellCycle.DotPlot.{pdf,png}                             周期蛋白基因的分布气泡图
│   ├── CellCycle.Heatmap.{pdf,png}                             周期蛋白基因在不同细胞周期的表达量热图
│   ├── Phase.stat.bySamples.pct.{pdf,png}                      不同样本的不同细胞周期细胞的数量比例堆叠图
│   ├── Phase.stat.bySamples.{pdf,png}                          不同样本的不同细胞周期细胞的数量堆叠图
│   ├── CellCycle.Cluster.tSNE.{pdf,png}                        不同细胞周期细胞与分群的tSNE分布
│   └── CellCycle.Samples.tSNE.{pdf,png}                        不同细胞周期细胞与样本的tSNE分布
├── 7.RNAVelocity                                           RNA速率分析
│   ├── velocity.trajectory.tSNE.{pdf,png}                      RNA速率轨迹图
│   └── velocity.tSNE.{pdf,png}                                 RNA速率分布图
├── index.html                                              单细胞分析结果网页版报告
├── scRNA-seq_method.pdf                                    单细胞分析方法说明(英文版)
└── src                                                     网页版报告系统文件文件夹
10 参考文献
- [1] cellranger : http://support.10xgenomics.com/single-cell/software/overview/welcome
- [2] Butler A, Hoffman P, Smibert P, et al. Integrating single-cell transcriptomic data across different conditions, technologies, and species. Nat Biotechnol. 2018;36(5):411-420.
- [3] Stuart T, Butler A, Hoffman P, et al. Comprehensive Integration of Single-Cell Data. Cell. 2019;177(7):1888-1902.e21.
- [4] van der Maaten Laurens and Hinton Geoffrey. Visualizing data using t-SNE. Journal of Machine Learning Research. 2008;9(November):2579–2605.
- [5] Aran D, Looney AP, Liu L, et al. Reference-based analysis of lung single-cell sequencing reveals a transitional profibrotic macrophage. Nat Immunol. 2019;20(2):163-172.
- [6] Ashburner M, Ball CA, Blake JA, et al. Gene ontology: tool for the unification of biology. The Gene Ontology Consortium. Nat Genetics, 2000;25(1):25-29.
- [7] Kanehisa M, Goto S. KEGG: kyoto encyclopedia of genes and genomes. Nucleic Acids Res, 2000;28(1):27-30.
- [8] Fabregat A, Jupe S, Matthews L, et al. The Reactome Pathway Knowledgebase. Nucleic Acids Res. 2018;46(D1):D649-D655. doi:10.1093/nar/gkx1132
- [9] Schriml LM, Mitraka E, Munro J, et al. Human Disease Ontology 2018 update: classification, content and workflow expansion. Nucleic Acids Res. 2019;47(D1):D955-D962.
- [10] Franceschini A, Szklarczyk D, Frankild S, et al. STRING v9.1: protein-protein interaction networks, with increased coverage and integration. Nucleic Acids Res. 2013;41(Database issue):D808-D815.
- [11] Hänzelmann S, Castelo R, Guinney J. GSVA: gene set variation analysis for microarray and RNA-seq data. BMC Bioinformatics. 2013;14:7.
- [12] Liberzon A, Birger C, Thorvaldsdóttir H, Ghandi M, Mesirov JP, Tamayo P. The Molecular Signatures Database (MSigDB) hallmark gene set collection. Cell Syst. 2015;1(6):417-425.
- [13] Weijun Liu and Xiaowei Wang. Prediction of functional microRNA targets by integrative modeling of microRNA binding and target expression data. Genome Biology. 2019; 20(1):18.
- [14] Yuhao Chen and Xiaowei Wang. miRDB: an online database for prediction of functional microRNA targets. Nucleic Acids Research. 2020;48(D1):D127-D131.
- [15] Griffiths-Jones S, Grocock RJ, van Dongen S, Bateman A, Enright AJ. miRBase: microRNA sequences, targets and gene nomenclature. Nucleic Acids Res. 2006;34(Database issue):D140-D144.
- [16] Yevshin I, Sharipov R, Kolmykov S, Kondrakhin Y, Kolpakov F. GTRD: a database on gene transcription regulation-2019 update. Nucleic Acids Res. 2019;47(D1):D100-D105.
- [17] Xie X, Lu J, Kulbokas EJ, et al. Systematic discovery of regulatory motifs in human promoters and 3' UTRs by comparison of several mammals. Nature. 2005;434(7031):338-345.
- [18] Subramanian A, Tamayo P, Mootha VK, et al. Gene set enrichment analysis: a knowledge-based approach for interpreting genome-wide expression profiles. Proc Natl Acad Sci U S A. 2005;102(43):15545-15550.
- [19] Segal E, Friedman N, Koller D, Regev A. A module map showing conditional activity of expression modules in cancer. Nat Genet. 2004;36(10):1090-1098.
- [20] Godec J, Tan Y, Liberzon A, et al. Compendium of Immune Signatures Identifies Conserved and Species-Specific Biology in Response to Inflammation. Immunity. 2016;44(1):194-206.
- [21] Macosko EZ, Basu A, Satija R, et al. Highly Parallel Genome-wide Expression Profiling of Individual Cells Using Nanoliter Droplets. Cell. 2015;161(5):1202-1214.
11 附录
11.1 分析方法英文文档
scRNA-seq分析方法文档(英文):scRNA-seq_method.pdf
11.2 结果文件查看
*.xls,*.txt :结果数据表格文件,文件以制表符(Tab)分隔。unix/Linux/Mac用户使用 less 或 more 命令查看;windows用户使用高级文本编辑器Notepad++ 等查看,也可以用Microsoft Excel打开。
*.png:结果图像文件,位图,无损压缩。
*.pdf:结果图像文件,矢量图,可以放大和缩小而不失真,方便用户查看和编辑处理,可使用Adobe Illustrator进行图片编辑,用于文章发表等。
11.3 文章引用与致谢
如果您的研究课题使用了基迪奥的测序和分析服务,我们期望您在论文发表时,在Method部分或Acknowledgements部分引用或提及基迪奥公司。以下语句可供参考:
- Method部分:The cDNA/DNA/Small RNA libraries were sequenced on the Illumina sequencing platform by Genedenovo Biotechnology Co., Ltd (Guangzhou, China).
- Acknowledgements部分:We are grateful to/thank Guangzhou Genedenovo Biotechnology Co., Ltd for assisting in sequencing and/or bioinformatics analysis.
